Prism Arrays
How Arrays work, how they're calculated, and how to interpret them.
Related guides: How to Buy Prisms Data · Reconstructing Prism Frameworks
1. Overview
A Prism tracks a group of companies, brands, or apps against a common metric, such as card spend or foot traffic, with a separate growth and share series for each member.
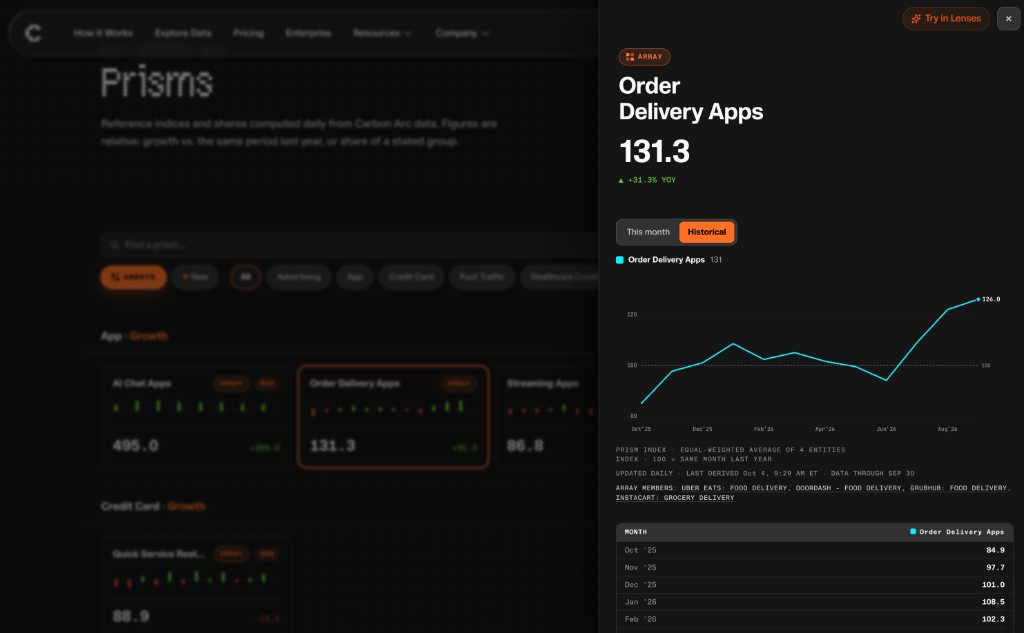
Arrays aggregate those members into a single, equally weighted growth index, providing a sector-level benchmark derived from an existing Prism.
A few governing principles:
- Equal weighting: Every member contributes equally, regardless of size. The Array is the simple average of its members' growth indices.
- Growth only: Arrays use the same year-over-year growth scale as Prisms, where 100 represents no change. They do not have a share view.
- Consistent coverage: Arrays use the same historical window as their source Prism and refresh daily as the underlying Prism updates.
On the Prisms page, Arrays are identified by an orange ARRAY badge. Use the Arrays filter to view them separately.
2. How Arrays are calculated
2.1 Growth index
Each Prism member has a monthly growth index calculated as:
Growth index = (Current month's value ÷ Same month last year's value) × 100
| Index | Interpretation |
|---|---|
| 100 | Flat year over year |
| 112 | Growth of 12% |
| 94 | Decline of 6% |
Arrays use the same scale as their source Prisms, making the two directly comparable. There is no separate base period.
2.2 Equal-weighted aggregation
For each month, an Array calculates the arithmetic mean of its members' growth indices.
Consider an illustrative Warehouse Clubs Array with three members:
| Month | Member A | Member B | Member C | Array |
|---|---|---|---|---|
| April | 106 | 103 | 98 | 102.3 |
| May | 108 | 104 | 97 | 103.0 |
| June | 110 | 105 | Missing | Gap |
In May, the Array's value of 103 indicates that the average member grew 3% year over year, even though Member C declined.
Equal weighting is intentional. A smaller member has the same influence as a larger one. Arrays measure the performance of the typical member, not the group's total spend, visits, or downloads.
2.3 Complete-member requirement
Arrays only calculate a value when every member has data for that period.
If one or more members are missing, the Array returns a gap rather than averaging the available members.
This maintains a consistent comparison group over time and prevents changes in data coverage from appearing as changes in sector performance.
For example, a newly tracked member without a full year of history may create gaps until year-over-year comparisons become available.
2.4 Historical and current-month views
Arrays support the same two growth views as Prisms:
| View | Coverage | Calculation |
|---|---|---|
| Historical | Completed months | Average of members' monthly growth indices |
| This month | Daily observations through the current month | Average of members' month-to-date growth indices, compared with the equivalent period last year |
The current month is excluded from Historical until it closes. This avoids comparing a partial month against a complete prior-year month.
The This month view provides the appropriate like-for-like comparison while the month remains open.
3. How to read an Array
Opening an Array displays three primary elements:
- Growth chart: A single sector-level growth series with a reference line at 100, representing flat year-over-year performance.
- Array members: The underlying members of the source Prism. Select a member to navigate to its individual Prism view.
- Notes: Any applicable caveats or context appear in a warning banner at the top of the drawer.
When interpreting an Array:
- Use 100 as the baseline. A value of 97 represents a 3% year-over-year decline.
- Use the Array as a benchmark. Compare individual members against the Array to identify relative outperformance or underperformance.
4. Arrays and underlying data
Arrays are calculated from the published growth indices of their source Prisms. They do not have a separate underlying data purchase.
To access the underlying absolute values, such as spend, visits, or downloads, purchase the data associated with the source Prism.
See How to Buy Prisms Data for the end-to-end workflow.
5. Developer reference
Arrays are available through Carbon Arc's public Prisms catalog, without authentication.
Endpoint: GET /v2/public-prisms
To retrieve the Arrays collection:
curl -s "https://api.carbonarc.co/v2/public-prisms" | jq '.indexes'
Response fields
| Field | Description |
|---|---|
index_id | Unique identifier for the Array |
title, category | Display name and catalog category |
source_prism_id | Identifier of the source Prism |
entities | Array members, returned as entity_key and title pairs |
entity_count | Number of members |
level | Monthly growth series, including null values for missing periods |
data_through | Latest date represented by the underlying data |
note, composition_caption | Optional contextual information displayed in the Array drawer |
The level field contains the historical monthly series:
[
  {"month": "2026-04", "value": 102.3},
  {"month": "2026-05", "value": 103.0},
  {"month": "2026-06", "value": null}
]
A null value indicates that at least one member lacks data for that month.
Need help? Contact us at support@carbonarc.co