Tribes
Tribes is Carbon Arc's audience-analytics product. You define an audience (a "Tribe"), point it at a brand or category, and Tribes quantifies how that audience's behavior diverges from the broader population: the brands they index toward, the brands they cross-shop, and how their spend is trending.
Tribes is built for one question: how a specific audience behaves in the context of a specific brand. It reads Carbon Arc's panel data and returns a measured view of what makes that audience distinct.
You can build a Tribe directly in the Views workspace, or start one conversationally through the Tribes persona in Lenses. Either path continues in Views, where the full rankings, trends, and comparisons live.
New to Tribes? The Getting Started guide walks through building your first Tribe, and the FAQs cover coverage, freshness, and billing.
What a "Tribe" is
A Tribe is a defined audience: a cohort you want to characterize. Today a Tribe is built from generation (Gen Z, Millennial, Gen X, Boomer), with additional dimensions (gender, income, and others) coming online as the underlying datasets land.
Every analysis is built from two choices:
| Choice | What it means | Example |
|---|---|---|
| Tribe (audience) | The customer cohort you're studying | Gen Z |
| Focus | The brand or category you're studying them at | Whole Foods Market, or the "Nondurable Goods" category |
Once both are set, every result is scoped to that audience at that brand. That scoping is what keeps the output specific rather than generic.
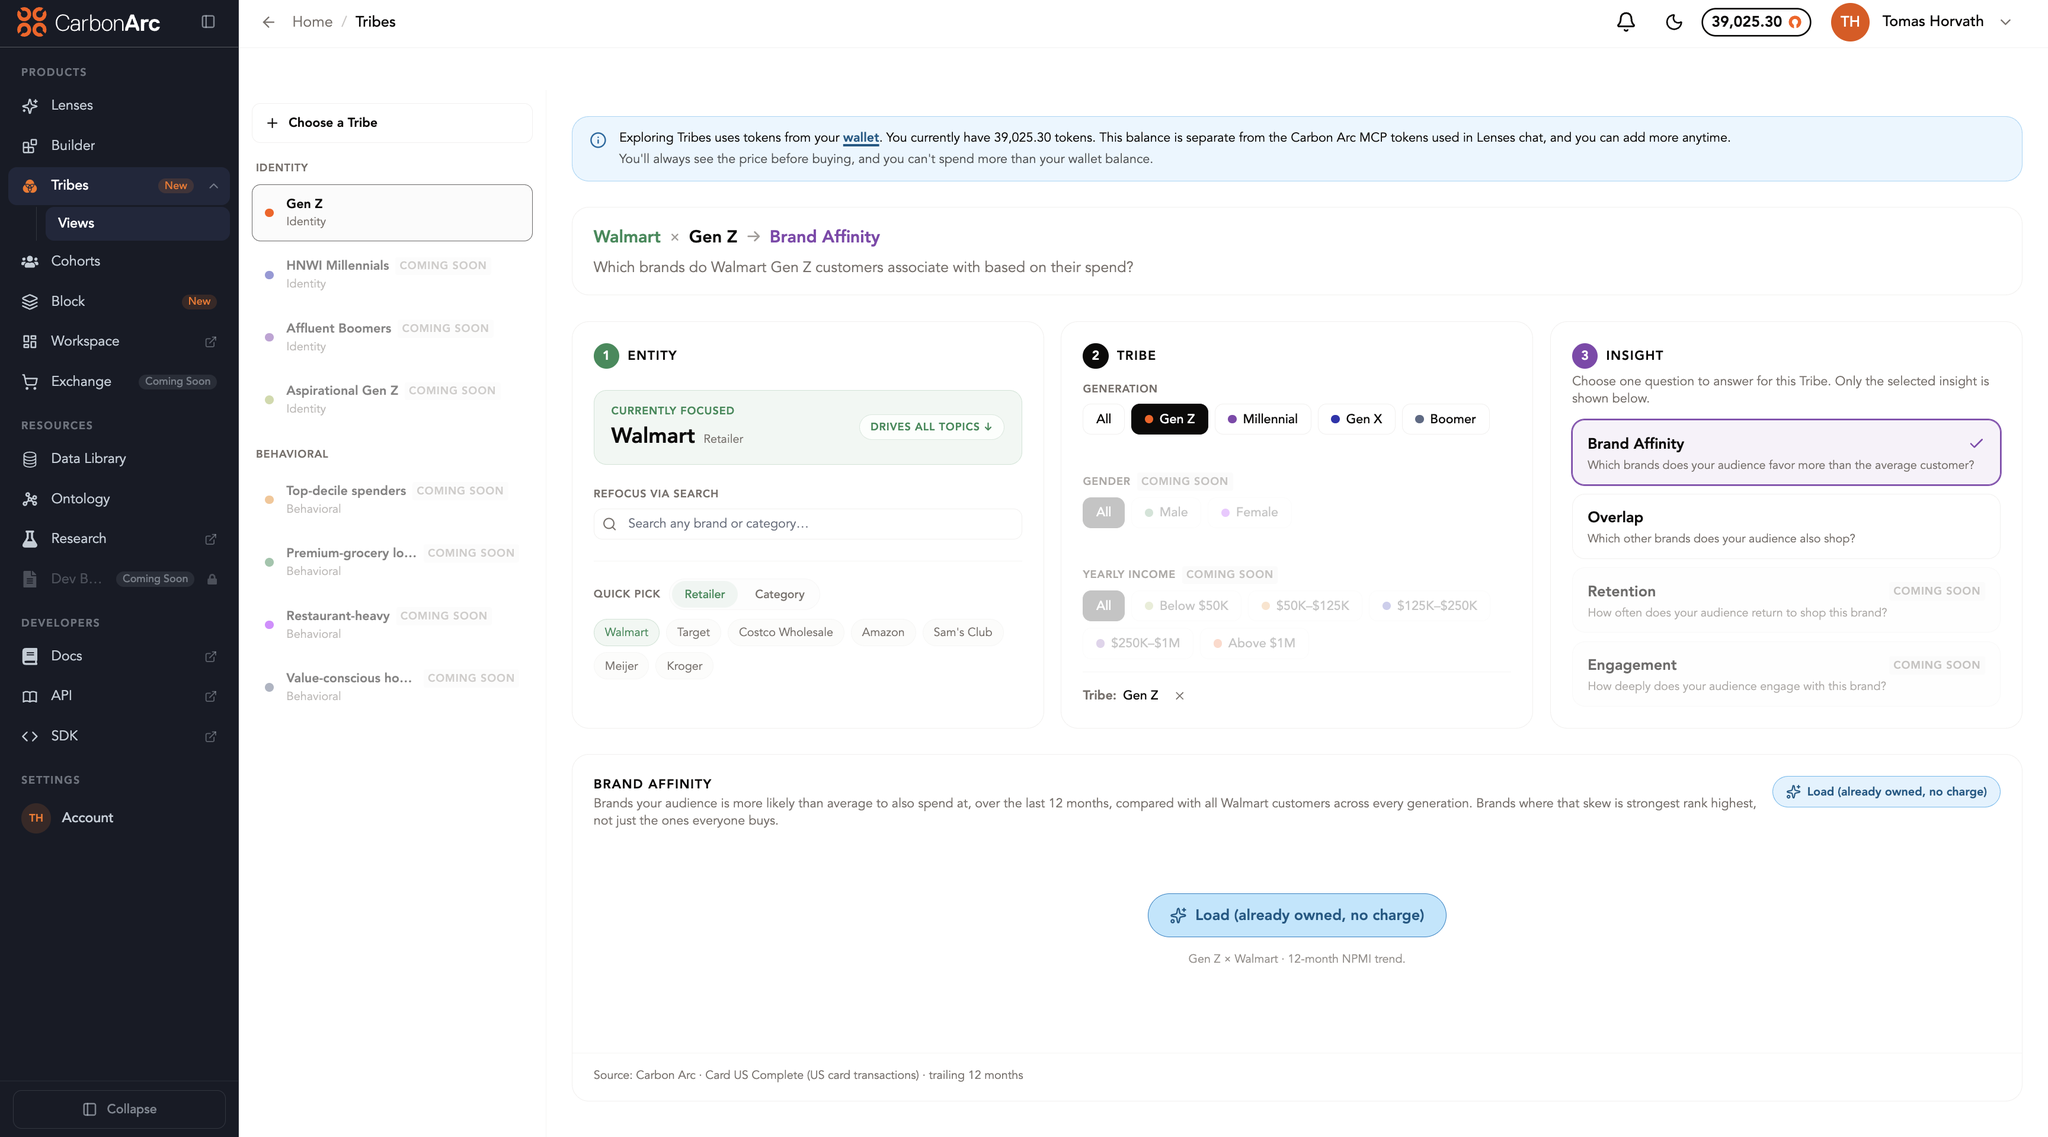
The three choices in the Views workspace: an Entity (here, Walmart), a Tribe (Gen Z), and an Insight (Brand Affinity). Gender and Yearly Income are marked "coming soon." Choose Load to render the result; data you already own loads at no charge.
How It Works
Every Tribes result is derived from three things working together:
| Source | Role |
|---|---|
| Your build | The Tribe, focus, and insight you choose, translated into precise Carbon Arc data calls |
| Carbon Arc panel data | Structured co-occurrence and spend data from Carbon Arc's data stack |
| Synthesis | When you start from Lenses, an LLM turns the returned data into a written summary; it introduces no new data. In Views, the same data renders directly as tiles, tables, and trends. |
You select the audience, focus, and insight; Tribes composes the exact data request and returns the result.
Building and exploring a Tribe
Tribes meets you in two places that work together. Views is the full workspace; Lenses is a quick conversational entry that returns a high-level read and hands off to Views for the complete data. Both read the same Carbon Arc data.
Build and explore in Views
Views is the primary Tribes workspace. Configure a Tribe in three steps (Entity, Tribe, Insight) and work with the results as ranked tiles, tables, deltas, and trends. This is where you scan many brands at once, compare audiences side by side, and read exact figures.
Start from Lenses (optional)
To start from a question instead, open Lenses, choose the Tribes persona, pick your Tribe and focus, and select a question. Tribes returns a quick, high-level read (a short summary plus a ranked table). For the complete data, deltas, and trends, follow the "See the full breakdown" link into Views.
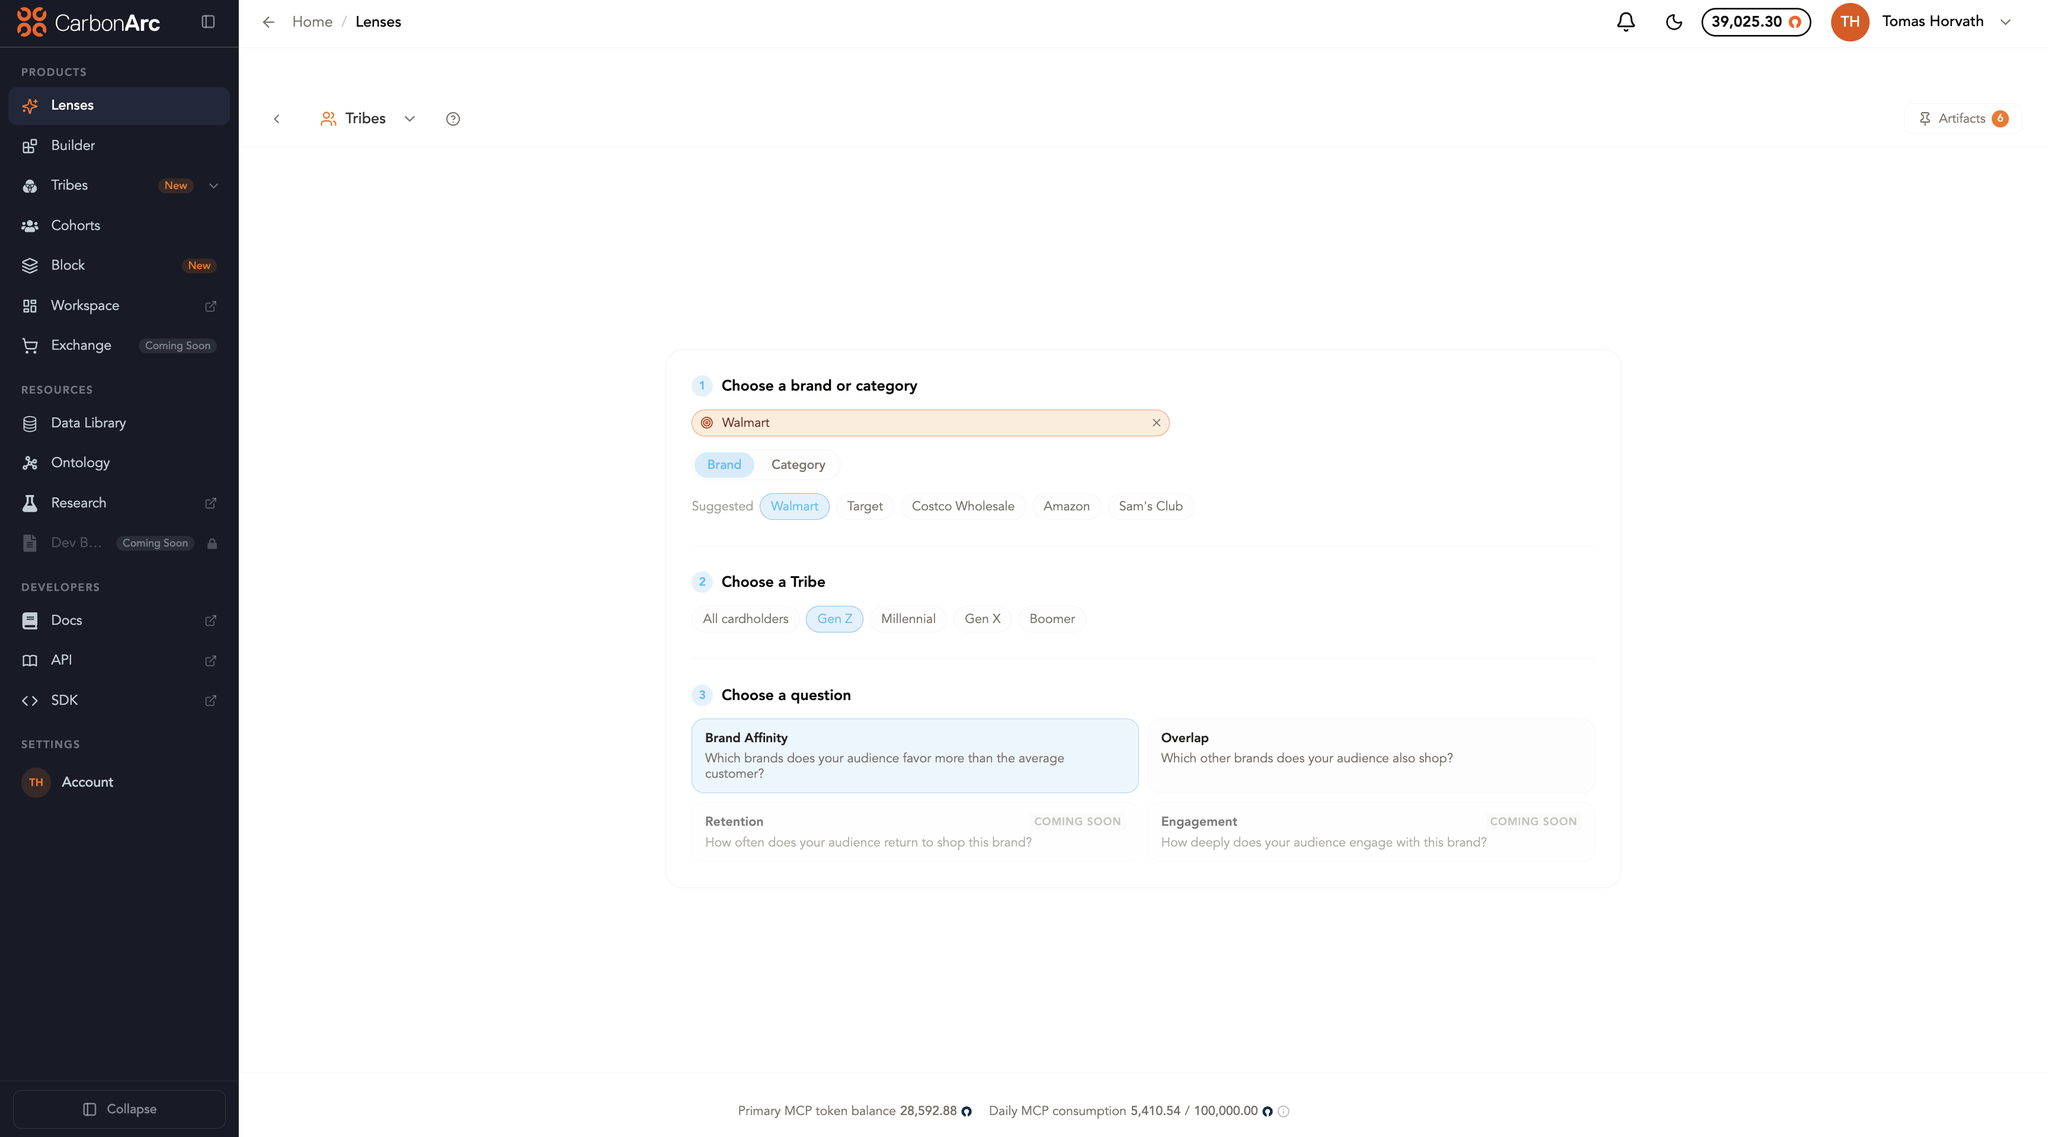
Starting from Lenses: choose a brand or category, choose a Tribe, then choose a question. Brand Affinity and Overlap are live; Retention and Engagement are marked "coming soon."
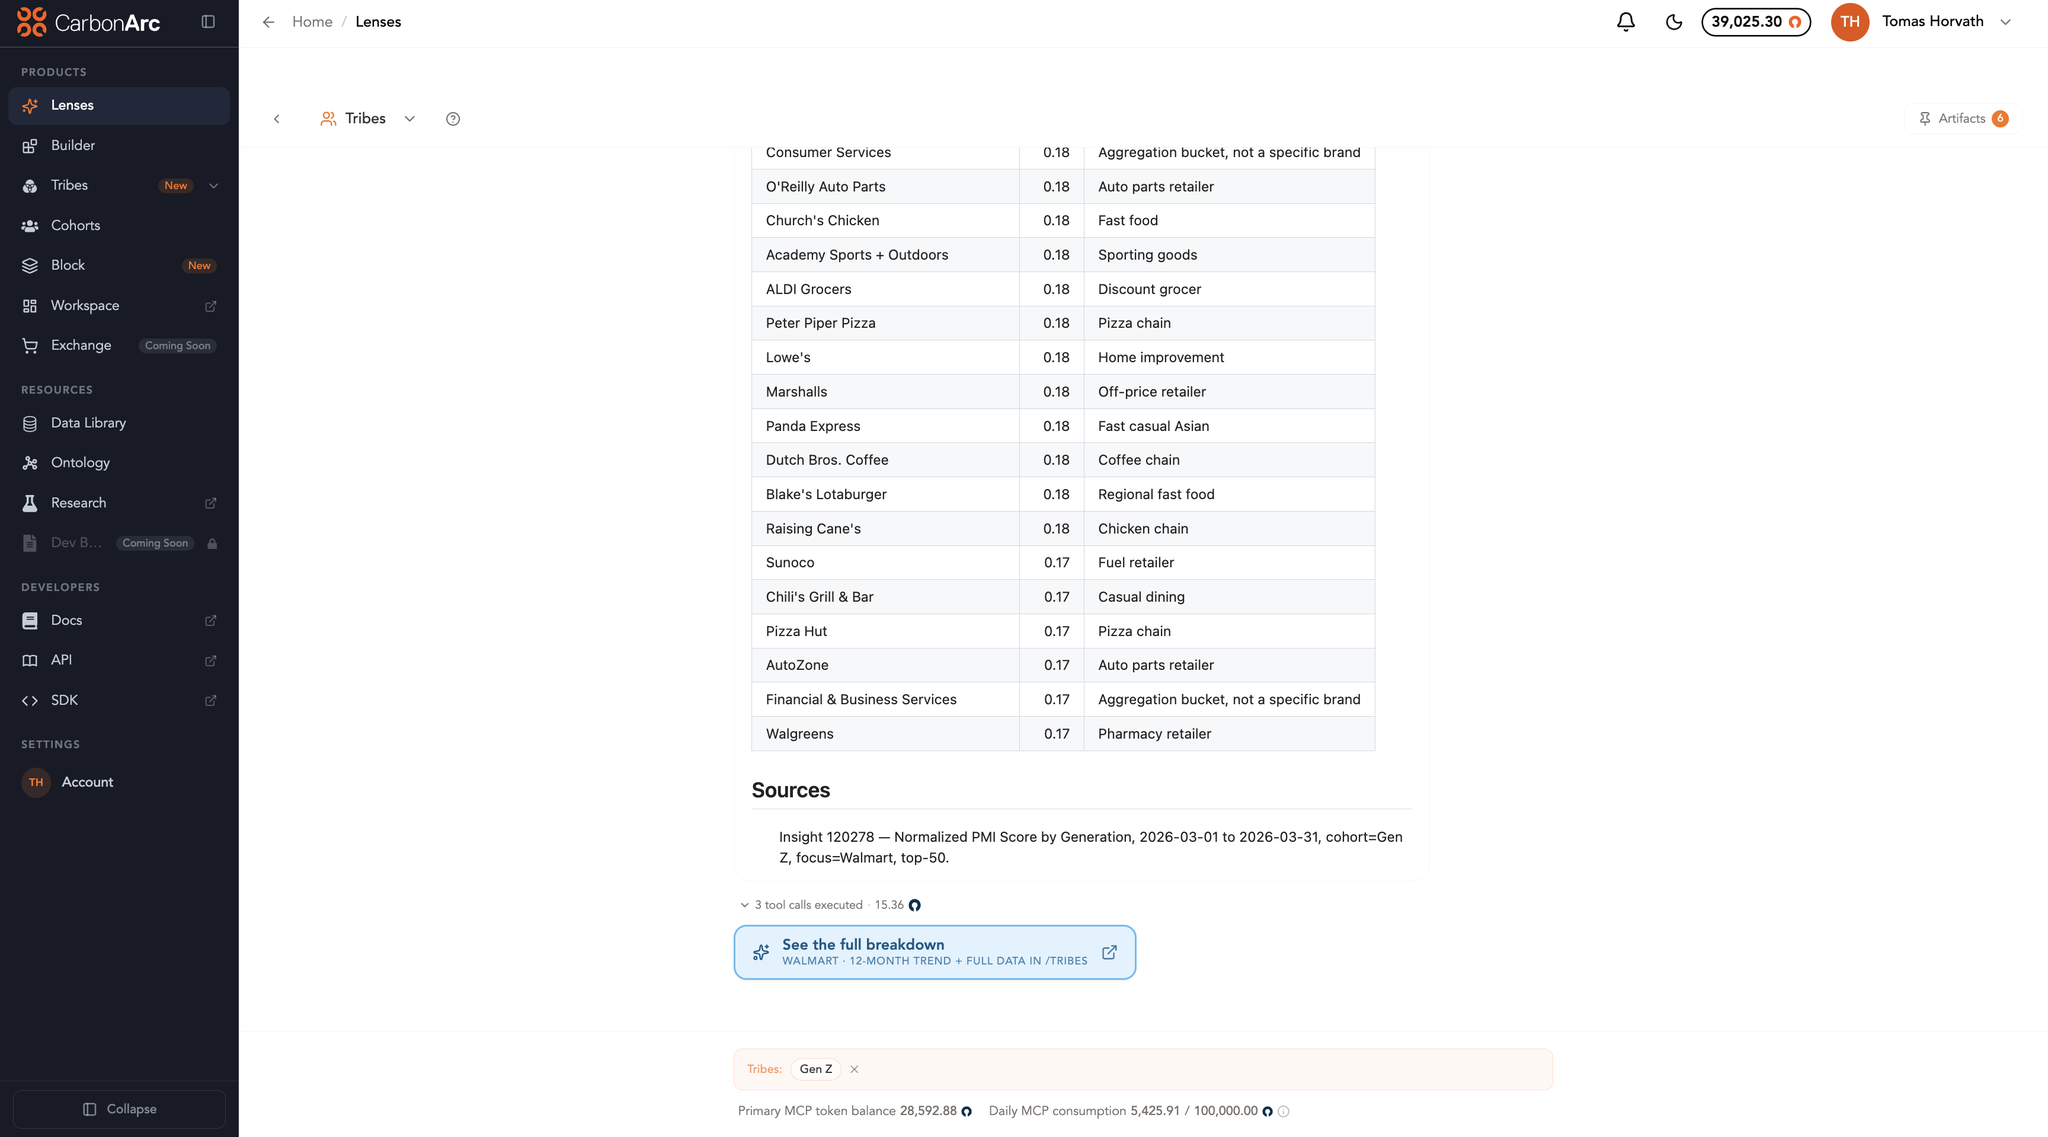
A Brand Affinity answer from Lenses for Gen Z at Walmart: a ranked table of brands with their affinity scores, a Sources note citing the underlying insight, and a "See the full breakdown" link that continues the analysis in Views.
The analyses
Each Tribes analysis describes what an audience does differently from the broader population, from a different angle. Brand Affinity and Overlap are available today, with more on the roadmap.
Brand Affinity
A ranking of the brands an audience shops most is dominated by what is popular across the whole population (Amazon, Walmart, McDonald's). Brand Affinity instead measures over-indexing: of the brands an audience also shops, which do they shop more than chance would predict?
The underlying metric is NPMI (Normalized Pointwise Mutual Information), a co-occurrence score normalized against an independence baseline:
- It compares how often two brands are shopped together against the rate you'd expect if the two were unrelated.
- 0 means no different from chance: the audience shops there about as often as the population does.
- A positive score means the audience is more likely than the average customer to also spend there.
- A negative score means the audience under-indexes: they shop there less than the population does.
Because NPMI is normalized, a smaller brand an audience skews toward can rank above a large brand they also happen to shop. In effect, the ranking reflects how distinctive a brand is to the audience rather than how large the brand is.
Brand Affinity is available for every focus, whether you pick a brand or a category.
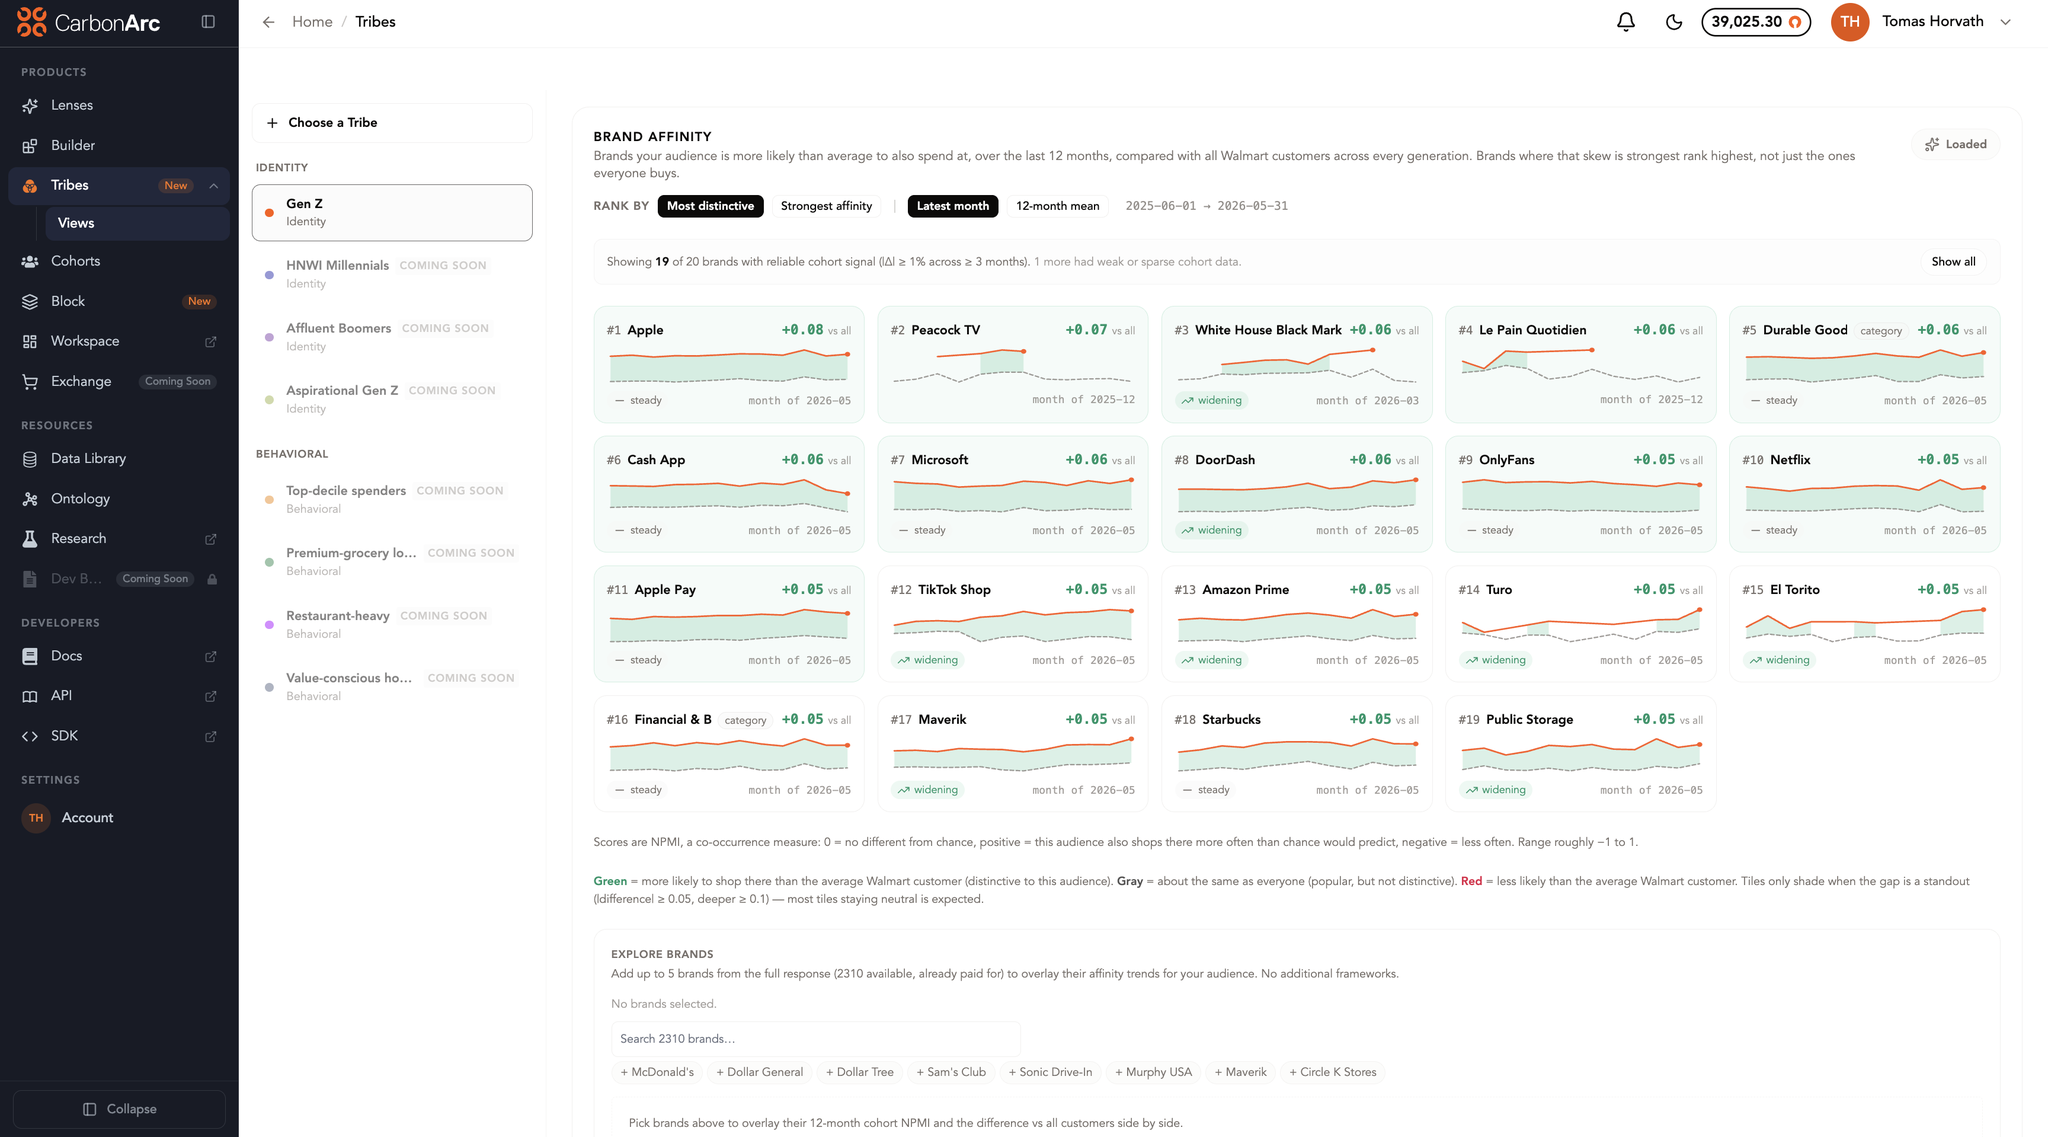
Brand Affinity for Gen Z at Walmart, with Rank by set to "Most distinctive" (over-index). Tiles are tinted green where the audience over-indexes and red where it under-indexes, each with a 12-month trend. A signal filter holds back brands with weak or sparse cohort data ("19 of 20 brands with reliable cohort signal").
Unique to this audience: the over-index against the baseline
A single affinity score still blends two things:
- A genuine audience skew: the brand resonates specifically with this audience.
- Broad popularity: the brand is popular with everyone who shops the focus, this audience included.
Tribes separates them with a difference (Δ) against the average customer: the audience's affinity minus the affinity of all the focus brand's customers for the same brand.
- High positive Δ: the audience indexes well above the baseline for that brand.
- Δ near zero: the audience indexes about the same as the overall customer base, even when the raw affinity is high.
- Negative Δ (anti-skew): the overall customer base indexes above this audience for that brand.
Affinity alone does not separate "this audience skews here" from "this is broadly popular." The Δ view adds that separation, and it is available as a one-click "Compare to all customers" follow-up on any Brand Affinity result.
A worked example: Gen Z at Walmart. By raw cohort affinity, McDonald's sits near the top and reads like a defining Gen Z signal. Net out the baseline and the ranking changes:
| Brand | Gen Z affinity | All Walmart customers | Over-index (Δ) | What it tells you |
|---|---|---|---|---|
| McDonald's | 0.24 | 0.20 | +0.04 | Popular across all Walmart shoppers; only a mild Gen Z skew |
| Whataburger | 0.24 | 0.19 | +0.05 | A genuine Gen Z skew |
| Dutch Bros. Coffee | 0.17 | 0.12 | +0.05 | A sharp Gen Z skew, invisible on a raw top-10 list |
| ALDI | 0.17 | 0.20 | −0.03 | Gen Z under-indexes; a mainstream-Walmart signal |
| Lowe's | 0.17 | 0.19 | −0.02 | Gen Z under-indexes |
Illustrative figures from Carbon Arc card data (Gen Z × Walmart, single month).
Compare the McDonald's and Dutch Bros. rows: nearly identical raw affinity, but different Δ. The over-index column is what separates a brand that is popular across all Walmart customers from one this audience skews toward.
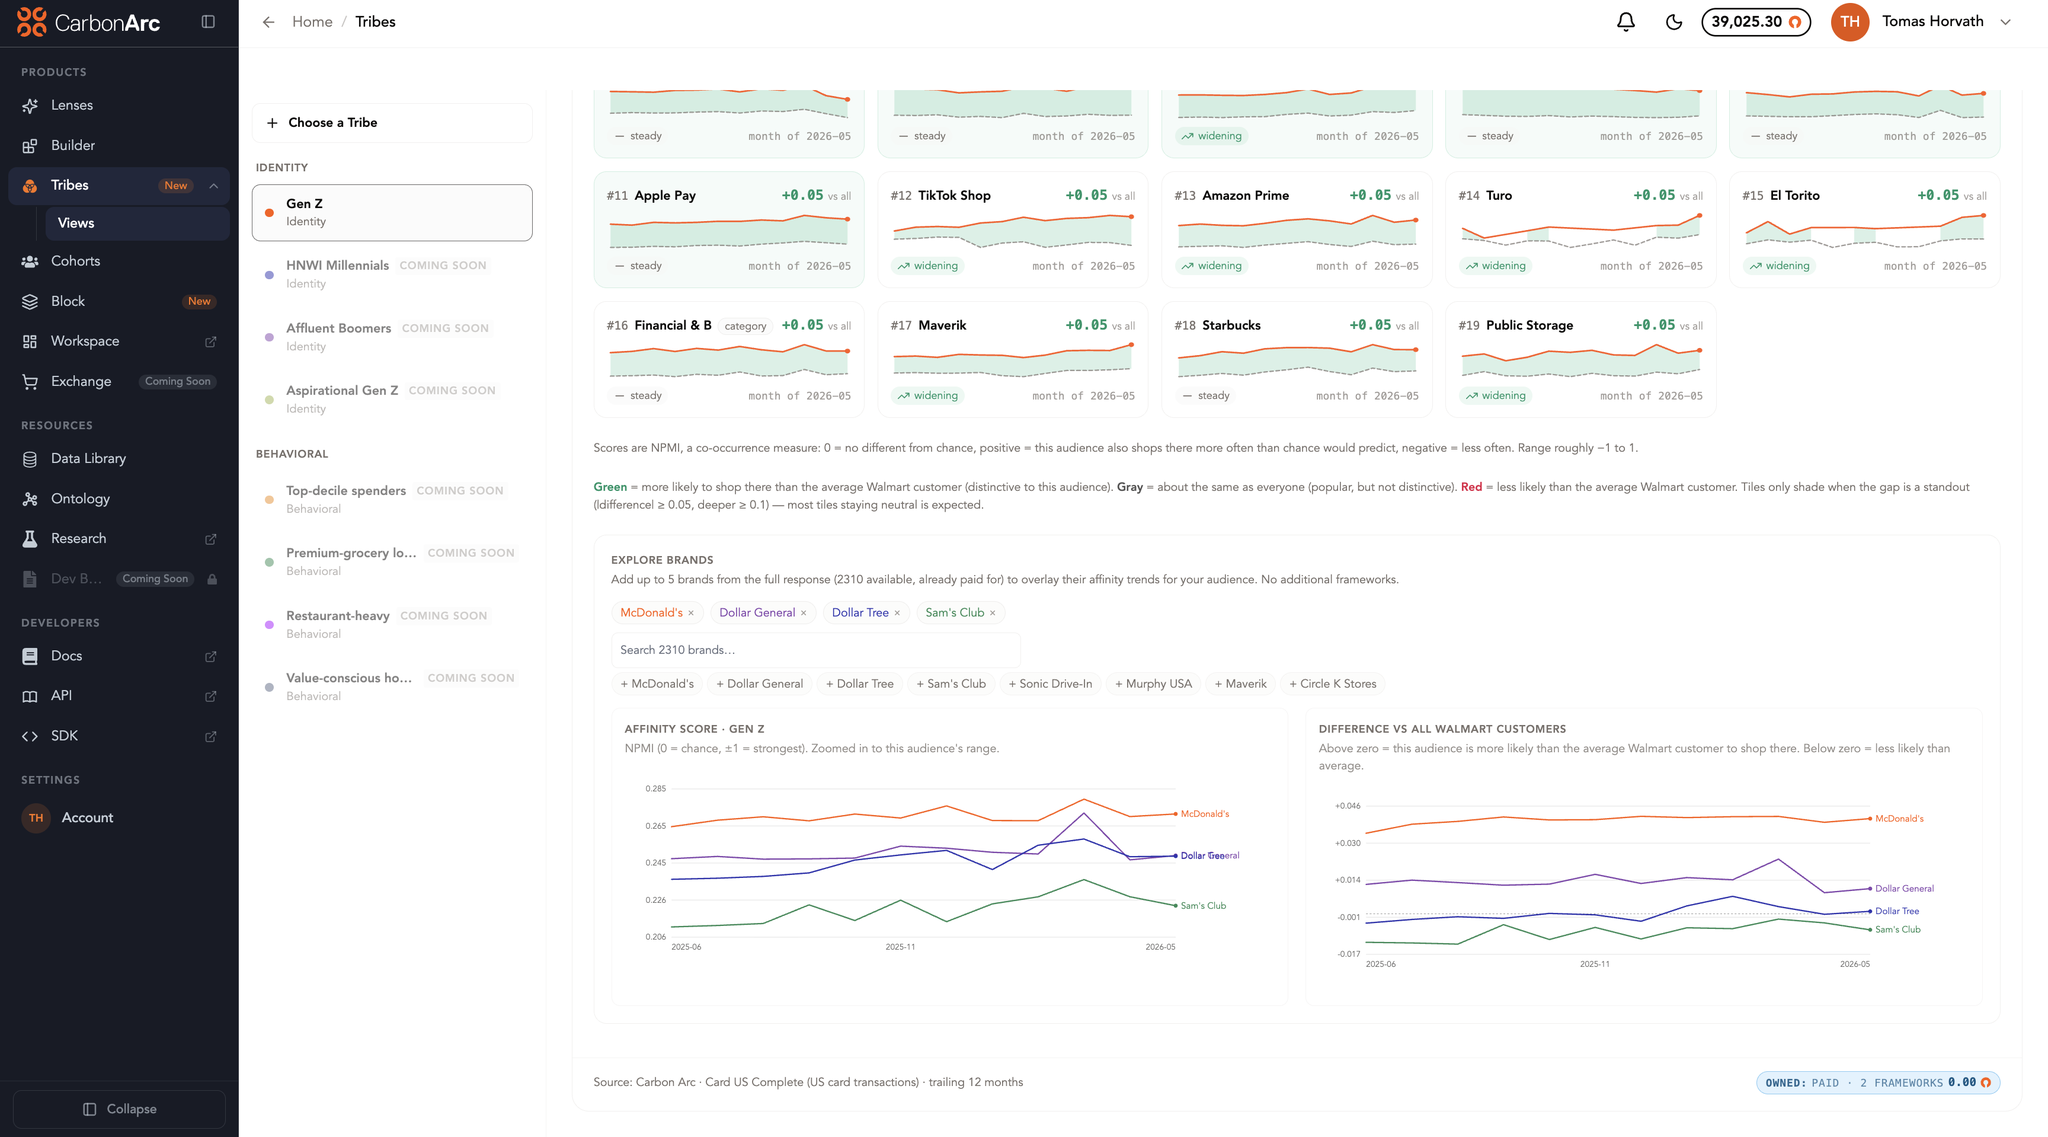
The legend states the read directly: green means more likely than the average Walmart customer (distinctive to this audience), grey means about the same as everyone (popular, not distinctive), red means less likely. The Explore view plots a brand's affinity score next to its difference versus all Walmart customers, the Δ that separates a real skew from broad popularity.
When an audience is most of a brand's customer base, its affinity and the population's affinity converge by construction, so Δ approaches zero. For focuses that narrow, Overlap (below) stays readable, since it compares raw shopping rates rather than a normalized score.
Overlap
Overlap answers the companion question: among the focus brand's customers, which other brands does this audience also shop, and do they shop them more than the average customer does?
Overlap is currently available for retailer focuses only.
Where Brand Affinity uses a normalized score, Overlap reports plain rates: the share of the audience that also shops each brand, next to the share of all customers who do, with the gap between them.
- Shared customers: how many of the audience cross-shop each brand.
- % of audience vs % of all customers: the audience's raw cross-shopping rate next to the population baseline.
- Δ vs the average customer: how far above or below the baseline the audience runs, in percentage points.
Because Overlap works in raw probabilities rather than a normalized score, it stays legible for small or narrow audiences where affinity scores get noisy. Brand Affinity and Overlap are complementary: Brand Affinity identifies what is statistically distinctive, while Overlap quantifies, in shopper-share terms, how much overlap exists.
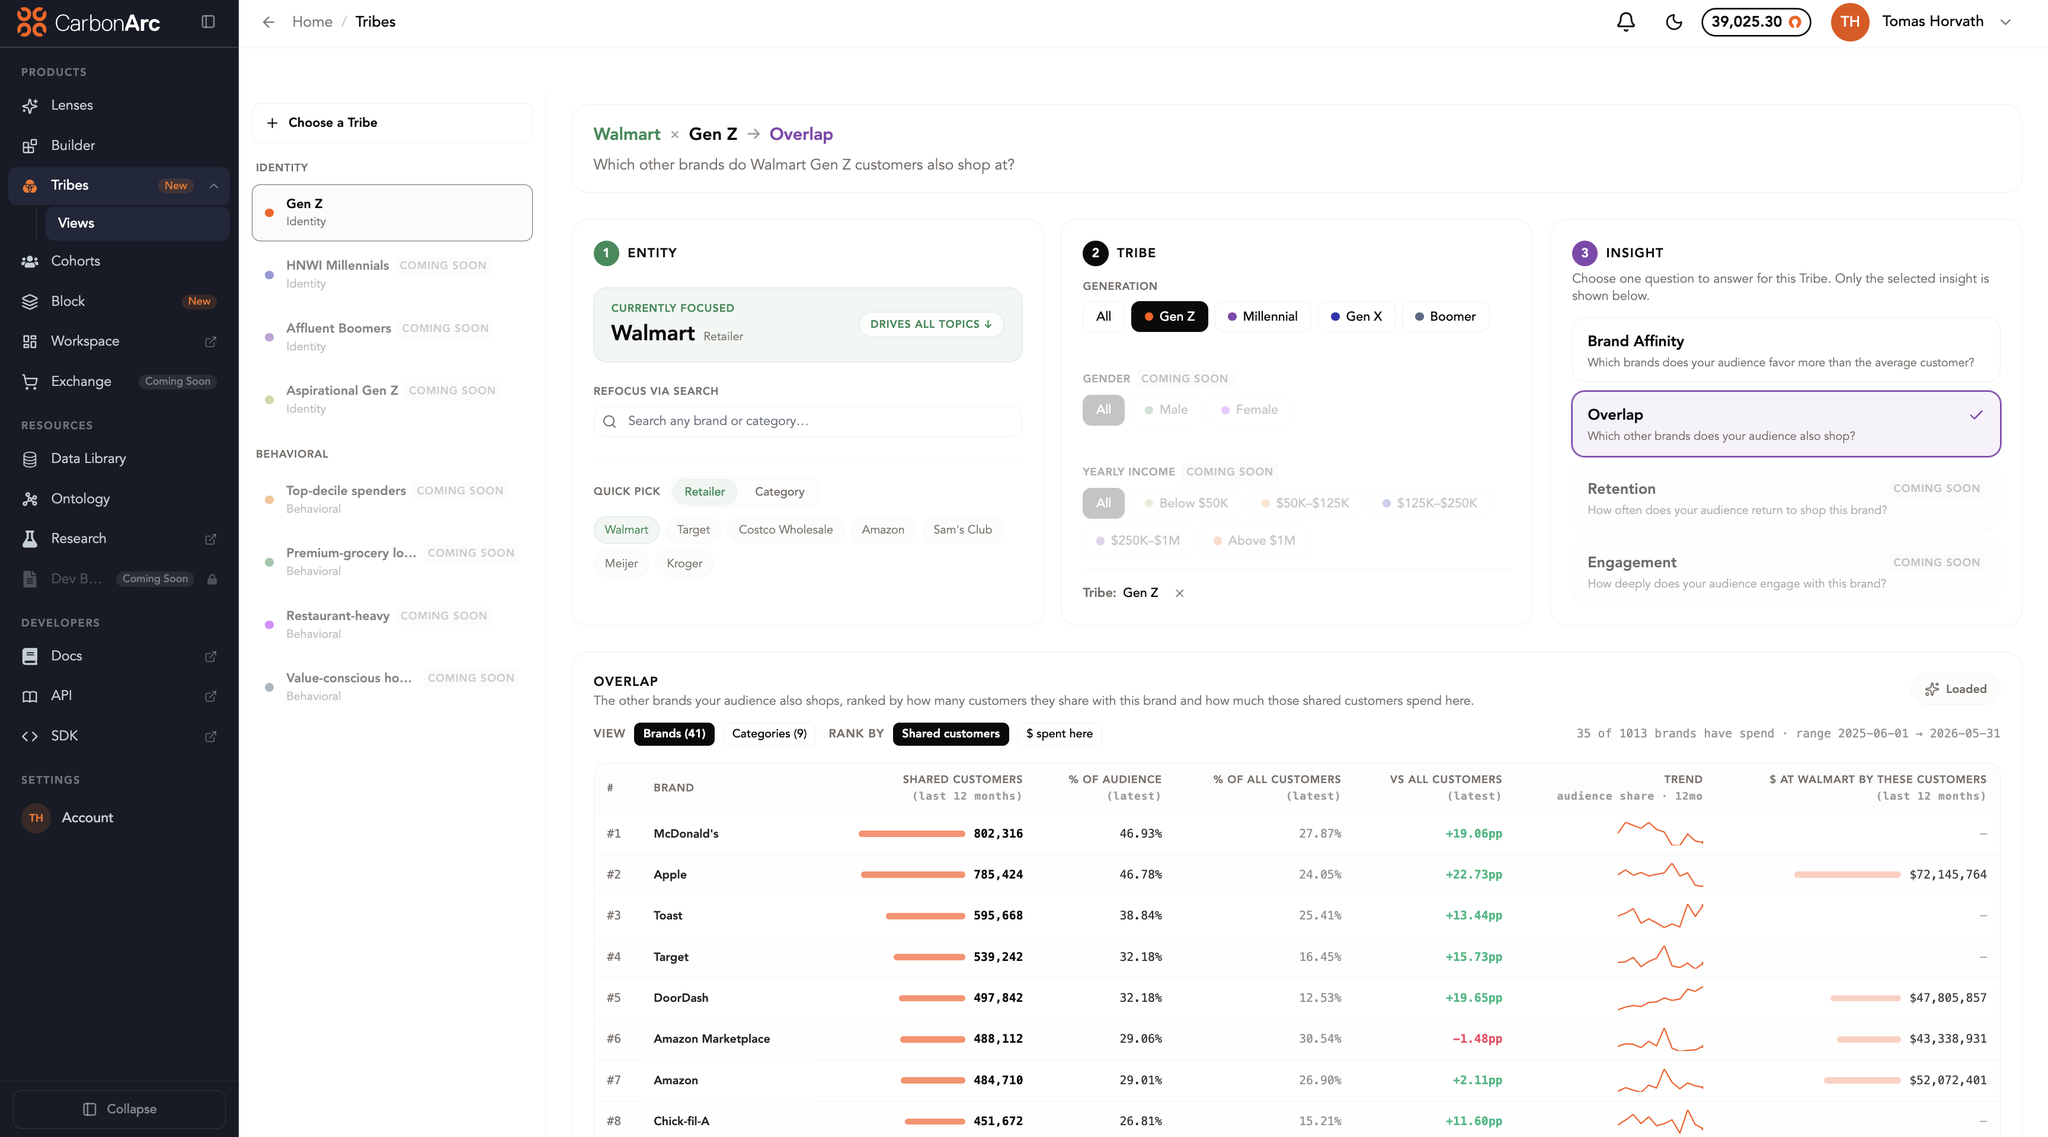
Overlap for Gen Z at Walmart: every other brand the audience also shops, ranked by shared customers, with "% of audience" beside "% of all customers," the gap as "vs all customers" in percentage points, a 12-month trend, and the dollars those cross-shoppers spend at the focus. A Brands / Categories toggle separates brand-scale from category-scale rollups.
Other insights on the roadmap
Brand Affinity and Overlap are available today. The remaining insights preview the roadmap and show as "coming soon" until their data lands:
| Insight | What it answers | Status |
|---|---|---|
| Brand Affinity | Which brands does this audience favor more than the average customer? | Available |
| Overlap | Which other brands does this audience also shop, and how unusually? | Available |
| Retention | How well does this audience stick with the brand over time? | Coming soon |
| Engagement | How does the audience split across spend and frequency tiers? | Coming soon |
Why Tribes works this way
Three deliberate decisions shape the product:
- Distinctiveness over volume. Every core metric measures how an audience differs from the baseline rather than how large it is.
- Interpretation when you want it, raw data when you don't. Start from Lenses for a written read, or build in Views for every row.
- Reproducible analyses. Your choice of Tribe, focus, and insight fully determines the data request, so results stay consistent and grounded in panel data rather than improvised.
Next Steps
- Follow the Getting Started guide to build your first Tribe.
- Browse the FAQs for coverage, freshness, and billing.
- Jump straight in: build a Tribe in Views, or start from the Tribes persona in Lenses.