Getting Started with Tribes
This guide walks through building your first Tribe and reading the result. For the concepts behind it, see the Overview; for coverage, freshness, and billing, see the FAQs.
Step 1: Open Tribes
Open the Tribes section in the platform navigation and go to Views to build directly. To start from a question instead, open Lenses and choose the Tribes persona; it hands off into Views when you want the full numbers.
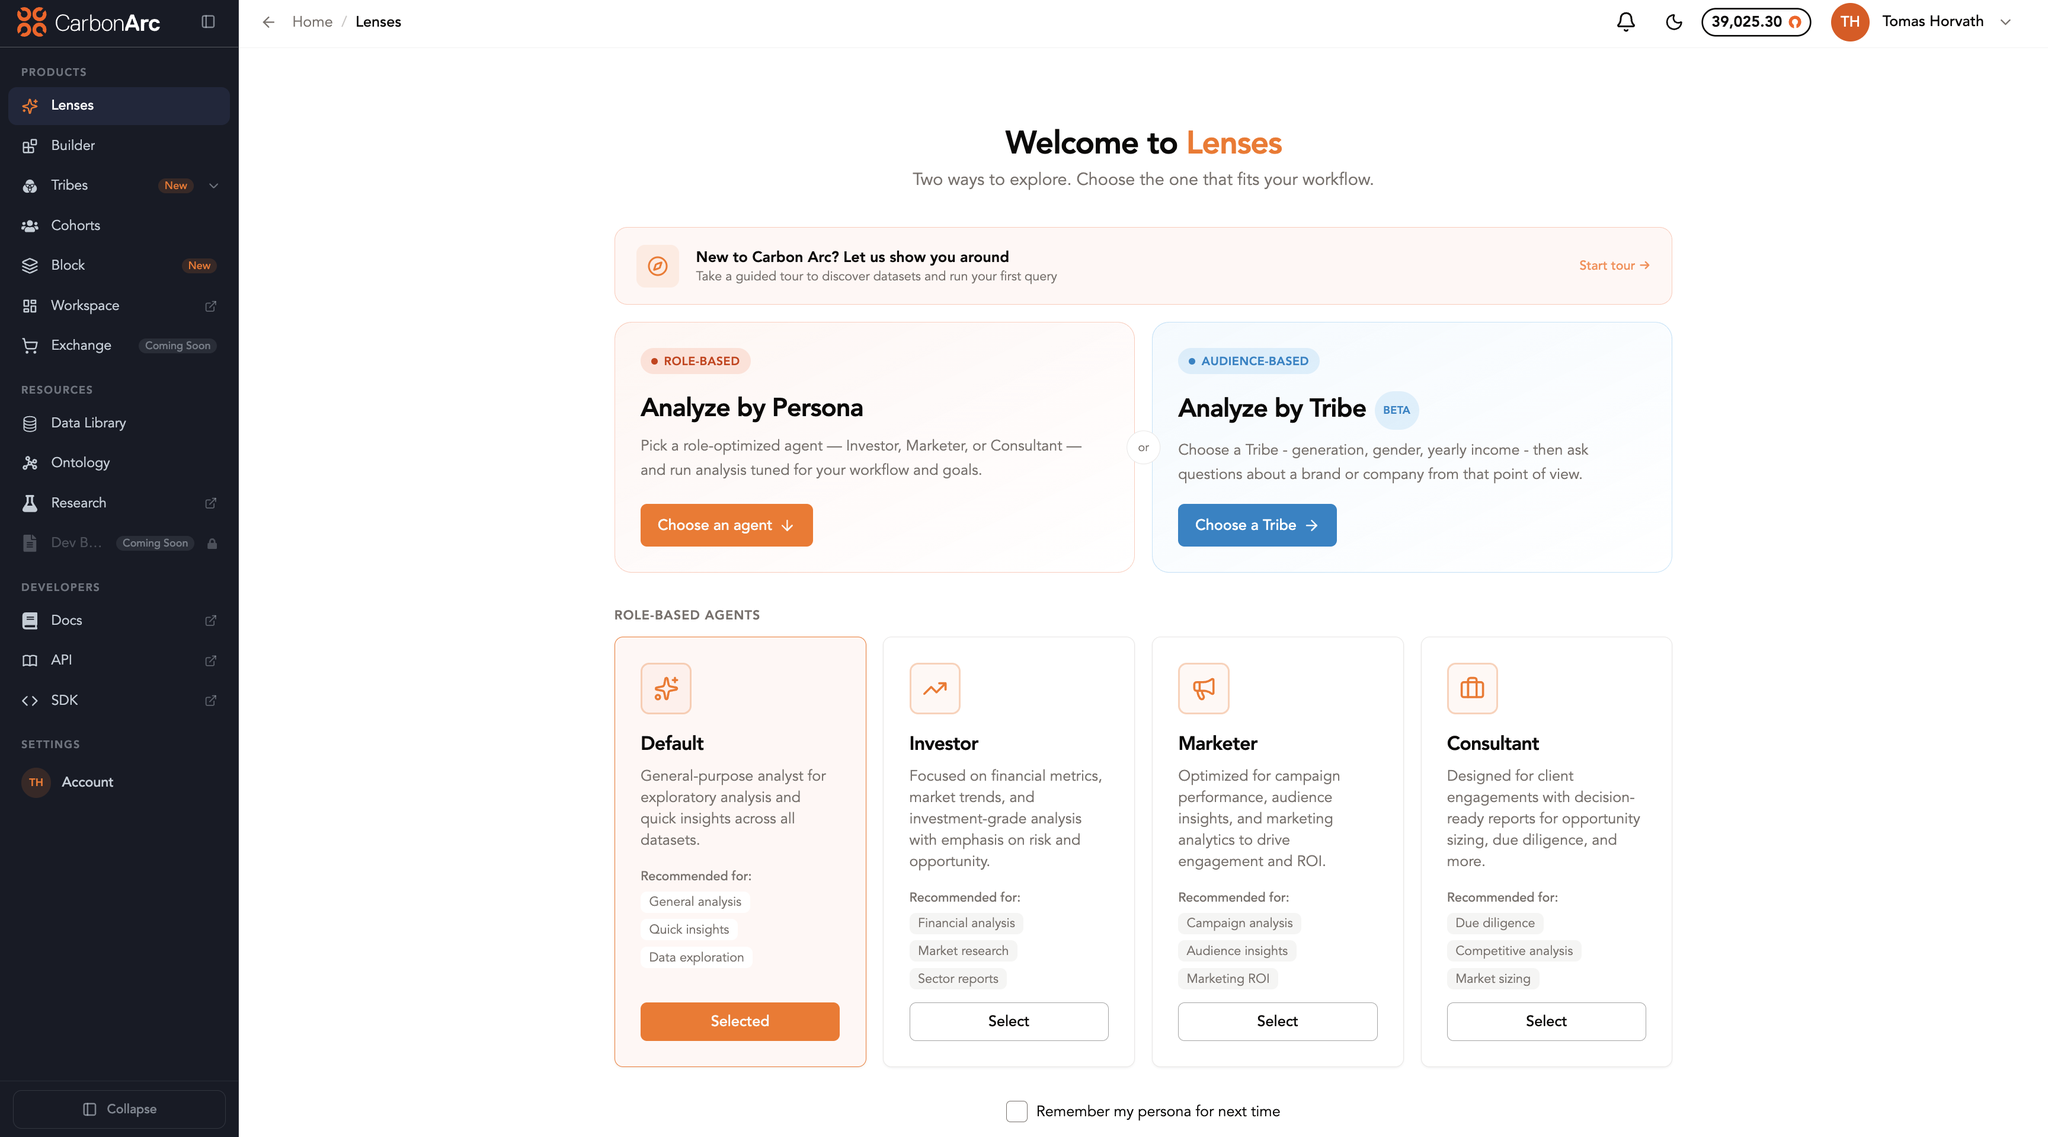
Lenses opens with two ways to work: Analyze by Persona or Analyze by Tribe. Choosing a Tribe starts the audience flow; Tribes also appears in the left-hand navigation.
Step 2: Choose a focus
Choose the brand or category to study, via a quick-pick chip (Walmart, Target, Costco, Amazon, Sam's Club, Meijer, Kroger for brands; the nine GICS sectors for categories) or the search field, with a toggle between brand and category focus. The focus drives every analysis on the page, so choose it deliberately.
Step 3: Build your Tribe
Select the audience to study (for example, Gen Z). You can pick a different audience at any time, and the view updates to match.
Step 4: Pick an insight and read the result
Choose an insight: Brand Affinity (available for any focus) or Overlap (currently retailer focuses only). Tribes loads the result as a ranked, explorable view. From Brand Affinity, use Compare to all customers to isolate what's genuinely distinctive.
Reading the results
A few conventions for interpreting the output:
- Affinity measures relative likelihood, not volume. A high-affinity brand is one the audience shops more than the average customer would, independent of the brand's absolute size.
- Affinity and Δ read together. When affinity is high but the Δ against all customers is near zero, the brand is popular across the focus's customers rather than specific to the audience.
- Negative Δ carries signal too. It marks brands the audience indexes below the overall customer base.
- Comparing Tribes. Running the same focus across Gen Z, Millennials, and Gen X and lining up the Δ columns shows where the cohorts diverge at the same focus.
- Specific brands vs category buckets. Some results include category buckets (for example, "Consumer Services") alongside specific brands; these describe the sector level rather than an individual brand.
- Affinity language is probabilistic. Results describe what an audience is more likely than average to do, not what it categorically "loves" or "favors."
For the meaning of affinity, the over-index (Δ), and Overlap, see The analyses in the Overview.