Sector Spotlight
Carbon Arc Data Assets: Homes.com Listings, Housing Permits, Credit Card – US Complete Panel, SMB Workforce, Vehicle Registration, Weather Data
End-of-Year Weakness Across Construction and Retail
January 20, 2026
Executive Summary
Housing is one of the largest sources of household wealth, GDP, and employment in the United States, but despite inflationary pressures elsewhere in the economy, home prices remain sluggish1 and housing starts are falling2. This decline is occurring even as the 30-year mortgage has fallen 50 basis points3 and the Fed has cut interest rates 75 basis points, making it easier to buy or build housing. Homebuilders are struggling to generate demand, even with lower prices; in December, Lennar reported 4% Y/Y growth in deliveries, but required increased sales incentives and lower margins to achieve that figure4. Home improvement retailers aren’t faring much better – comparable sales at both Home Depot and Lowe’s are roughly flat so far in FY2025.
This week’s sector spotlight highlights trends in home sales, construction, and renovation across listings, permit, consumption, and employment data.
Key Takeaways
-
In contrast to median home prices increasing in from 2Q – 4Q every year back to 20125, prices of smaller homes and apartments decreased across the second half of 2025. Prices are ~flat over the last 9 months in the southern U.S. but decreasing > 10% in New England and the Great Lakes region.
-
New construction permits for D.R. Horton and Pulte Group trail the broader housing market, but Lennar has been growing more rapidly. Lennar’s reported +4% Y/Y growth in homes delivered from September-November implies negative CY4Q25 growth for Pulte and D.R. Horton, in-line with guidance. D.R. Horton finally showed momentum in December, surpassing the U.S. market for the first time in 20 months.
-
Average job value and issued permit count for common home renovations are ~flat to down Y/Y across renovation types. Pool construction is showing the greatest resistance to cost-cutting in job value, but has the greatest decline in issued permits.
-
Card spend at Home Depot and Lowe’s suggests net sales in-line with management guidance, but continued negative momentum post-Christmas could drive a miss.
-
Construction employment fell -1.4% Y/Y in December to a 10-month low, driven by job losses in the Midwest and Pacific regions.
-
Greater rainfall and lower temperatures in October 2025 contributed to Home Depot and Lowes’ weak month, but sales in January are lagging despite warmer, drier weather that should increase home improvement activity.
Home Prices Falling Across the U.S.
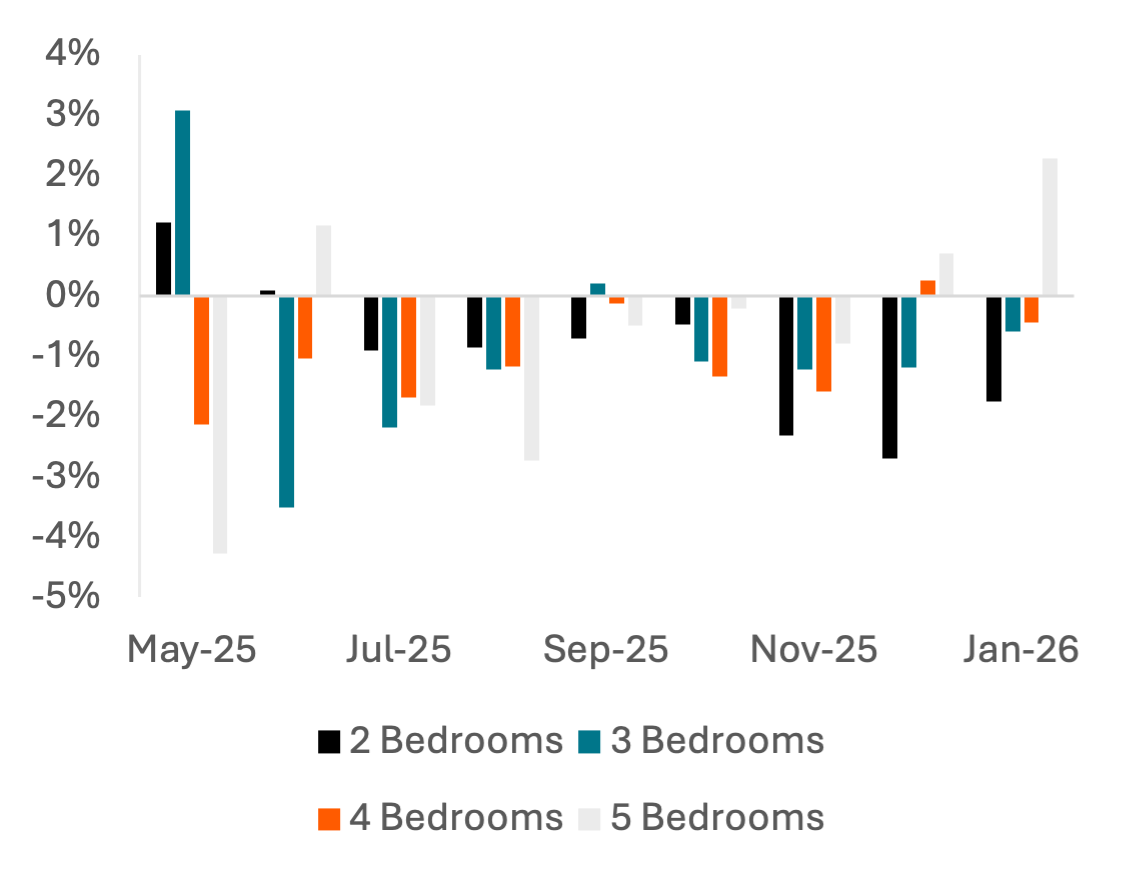
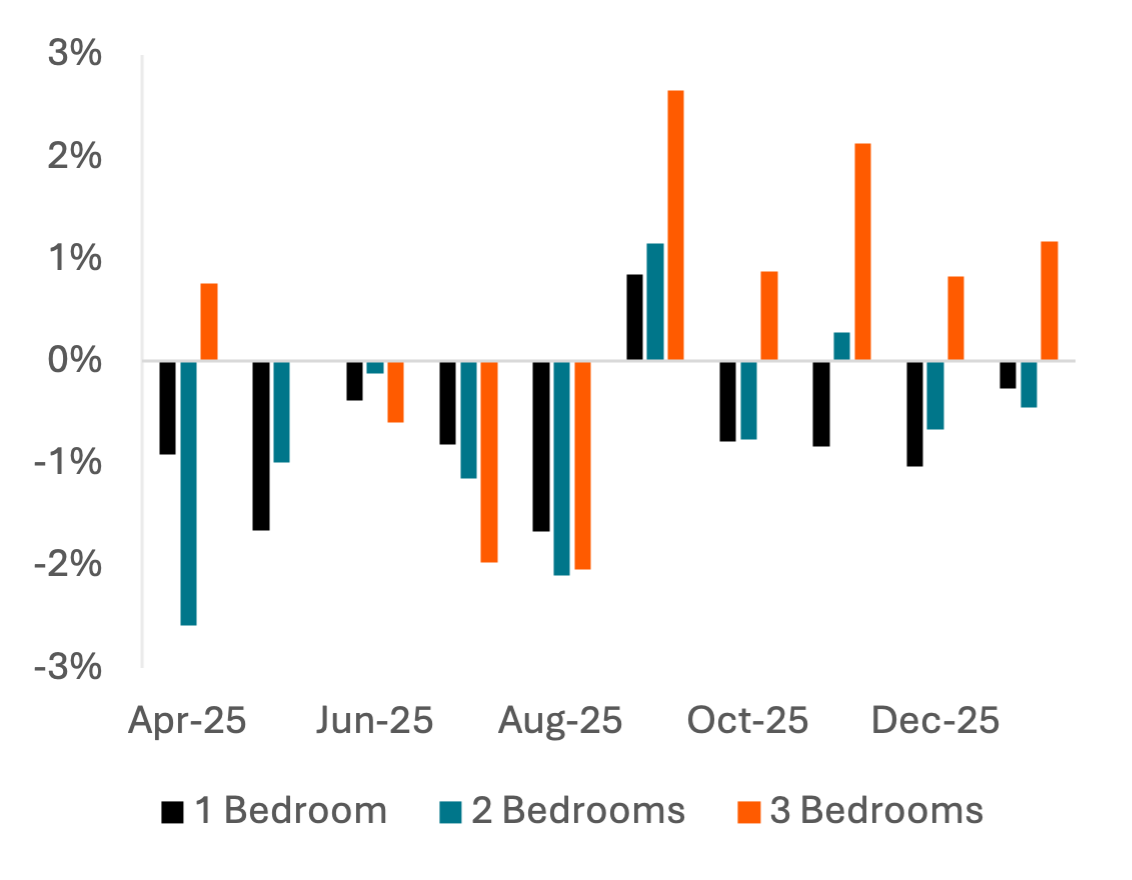
In contrast with median home prices increasing 2Q-4Q for the prior 13 years, average listing prices on homes.com have consistently fallen 1-2% M/M. This price drop is occurring despite the average 30-year mortgage rate falling 50 bps over the last 9 months of 2025, making purchases more affordable. The recent recovery in prices for more-expensive 5-bedroom homes and 3-bedroom apartments is reflective of a K-shaped economy where higher-income consumers are the only ones able to spend more.
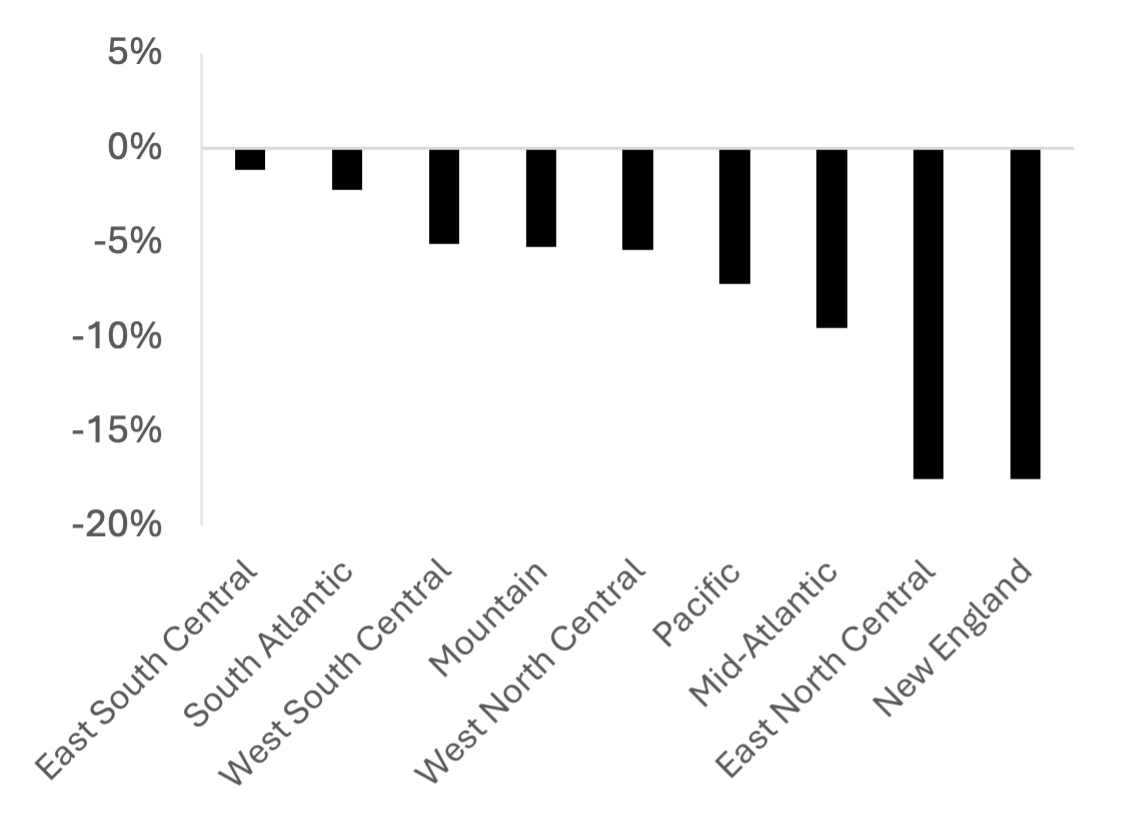
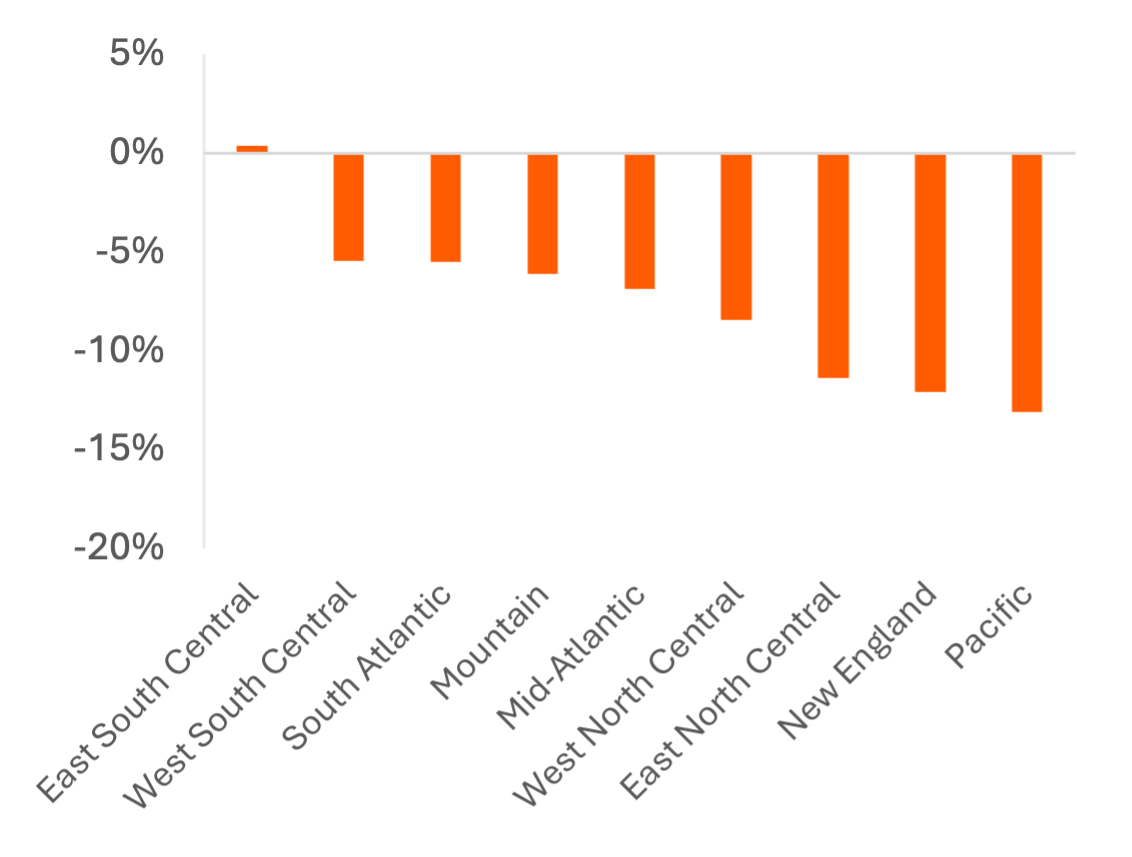
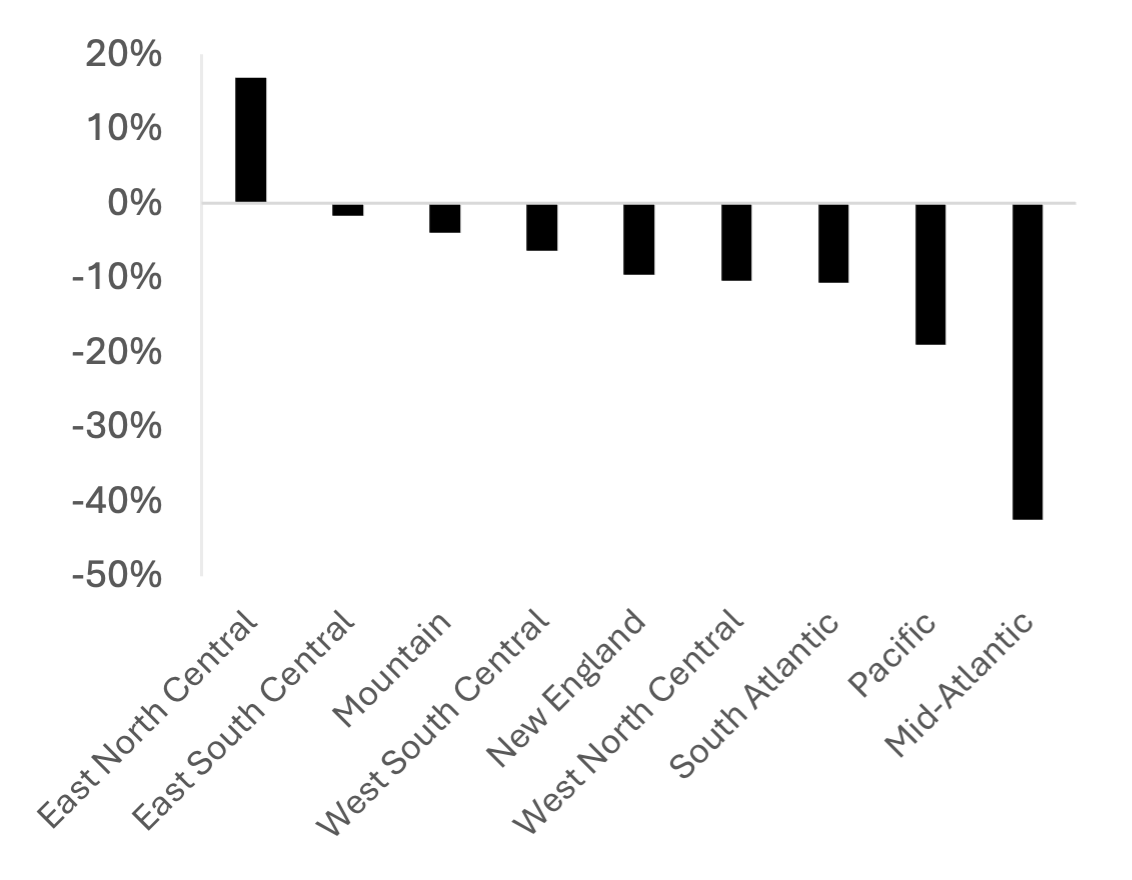
Home values in the southern U.S. are more stable, with prices falling 0 – 5% over the past 9 months, vs. 10+% drops across homes and apartments in New England and the Great Lakes/Rust Belt subregion of the Midwest (“East North Central” on the census). The Pacific region has the largest difference in apartment and home price trends, reflecting the surge in multifamily construction in California from 2020-2023.
Exhibit 1: M/M House Price Growth by Bedrooms
Price: Requires row-level block data access, available on request
Exhibit 2: M/M Apartment Price Growth by Bedrooms
Price: Requires row-level block data access, available on request
Exhibit 3: April 2025 – January 2026 Average 1-Bedroom Apartment Price Change
Price: Requires row-level block data access, available on request
Exhibit 4: April 2025 – January 2026 Average 3-Bedroom House Price Change
Price: Requires row-level block data access, available on request
Major Homebuilders Underperforming Total U.S. Permit Growth
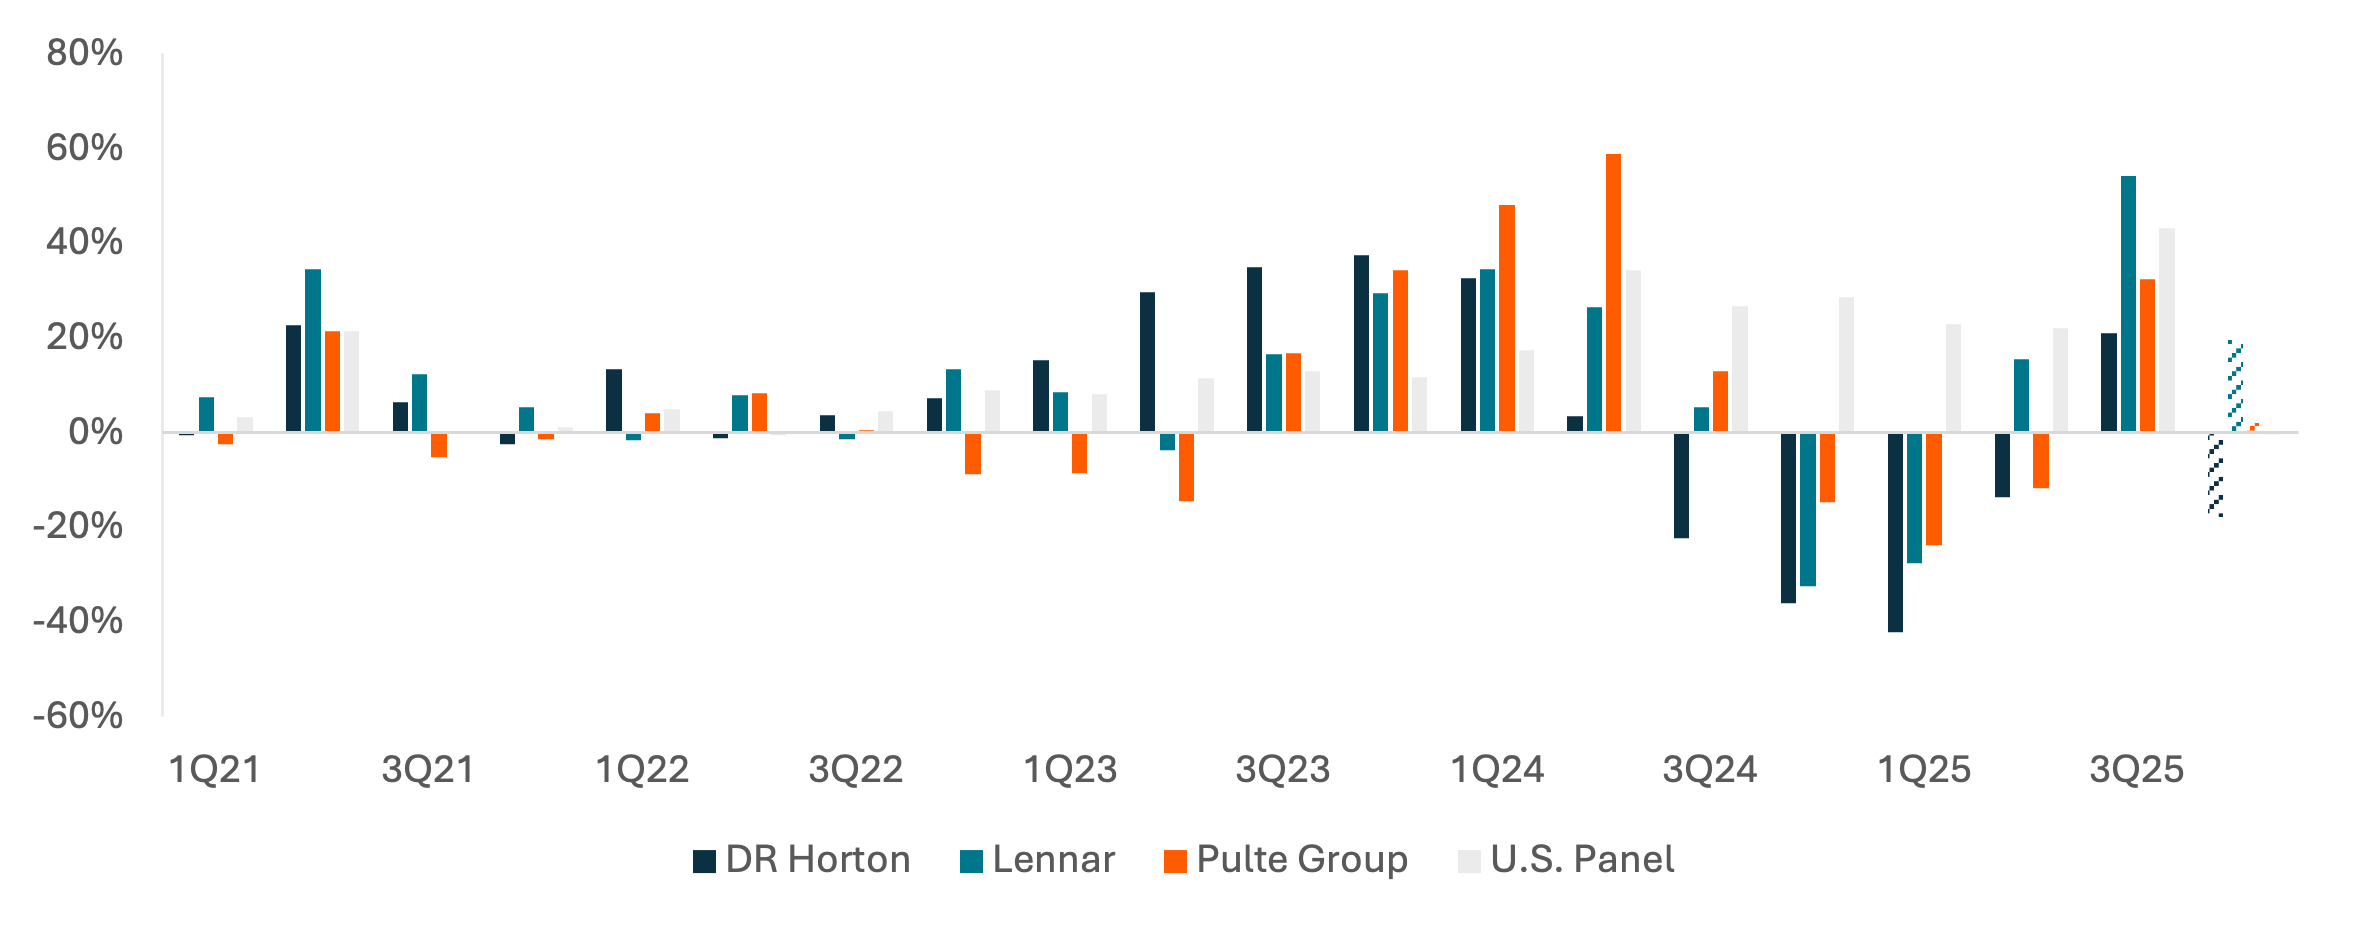
Construction permit volumes suggest Lennar remains the fastest-growing of the U.S.’s largest homebuilders, outgrowing the U.S. housing sector in CY3Q25 and 4Q25. Growth at both D.R. Horton and Pulte Group has trailed the broader U.S. housing sector since 2Q24, with D.R. Horton underperforming Pulte in each quarter. Lennar reported deliveries growth of +4% Y/Y from September – November in their 4Q earnings report, suggesting D.R Horton and Pulte will report negative closings growth, in-line with guidance of approximately -10% and -2% Y/Y, respectively.
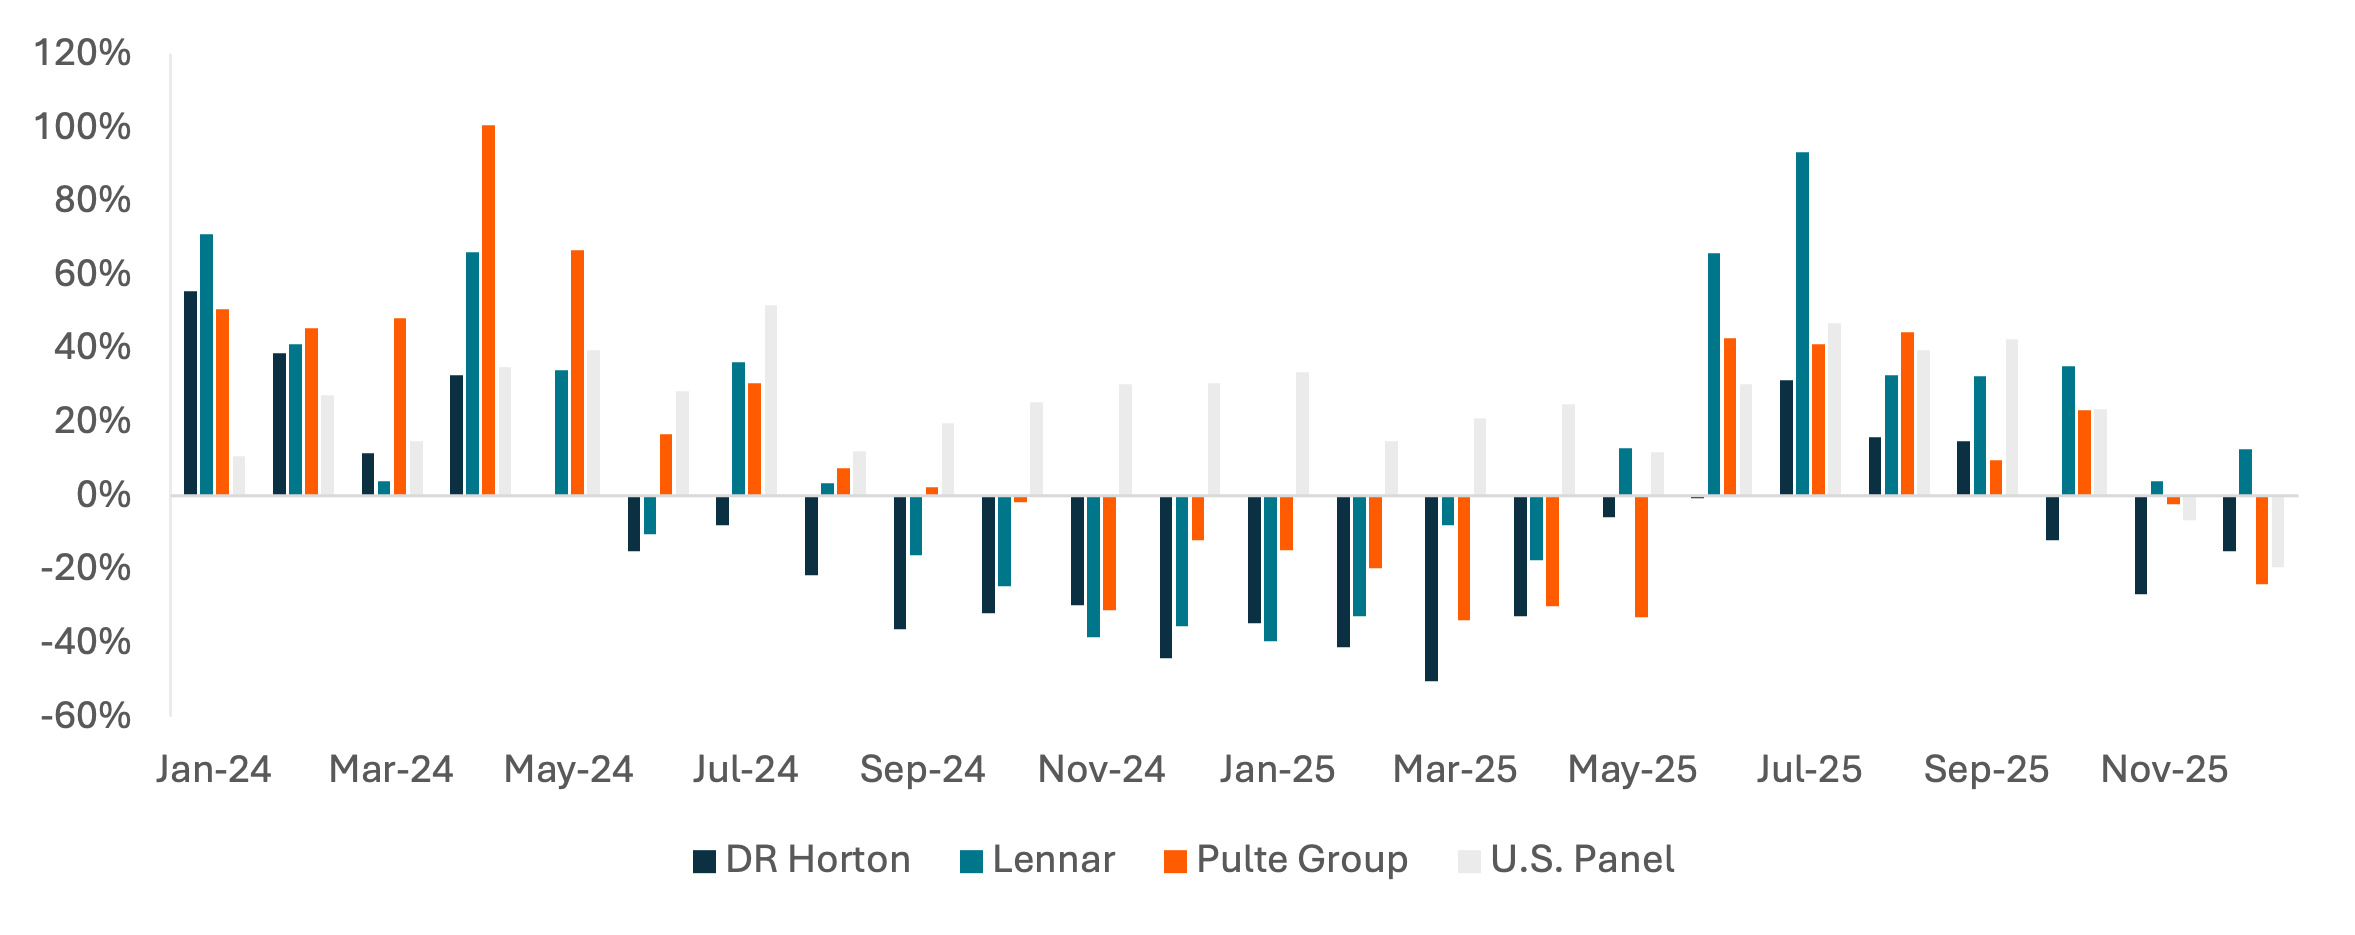
Delays in permit reporting by county may increase permit totals in recent months, but monthly data suggests slight recoveries for Lennar and D.R. Horton in December following a weaker November, while permits for Pulte Group continued to deteriorate Y/Y and underperformed the U.S. market. December is the first month since February 2024 in which D.R. Horton’s Y/Y permit growth exceeded overall residential construction permit growth.
Exhibit 5: New Construction Permits Y/Y Growth
Price: Requires row-level block data access, available on request
Exhibit 6: New Construction Permits Y/Y Growth, Monthly
Price: Requires row-level block data access, available on request
Renovation Permit Values in Decline
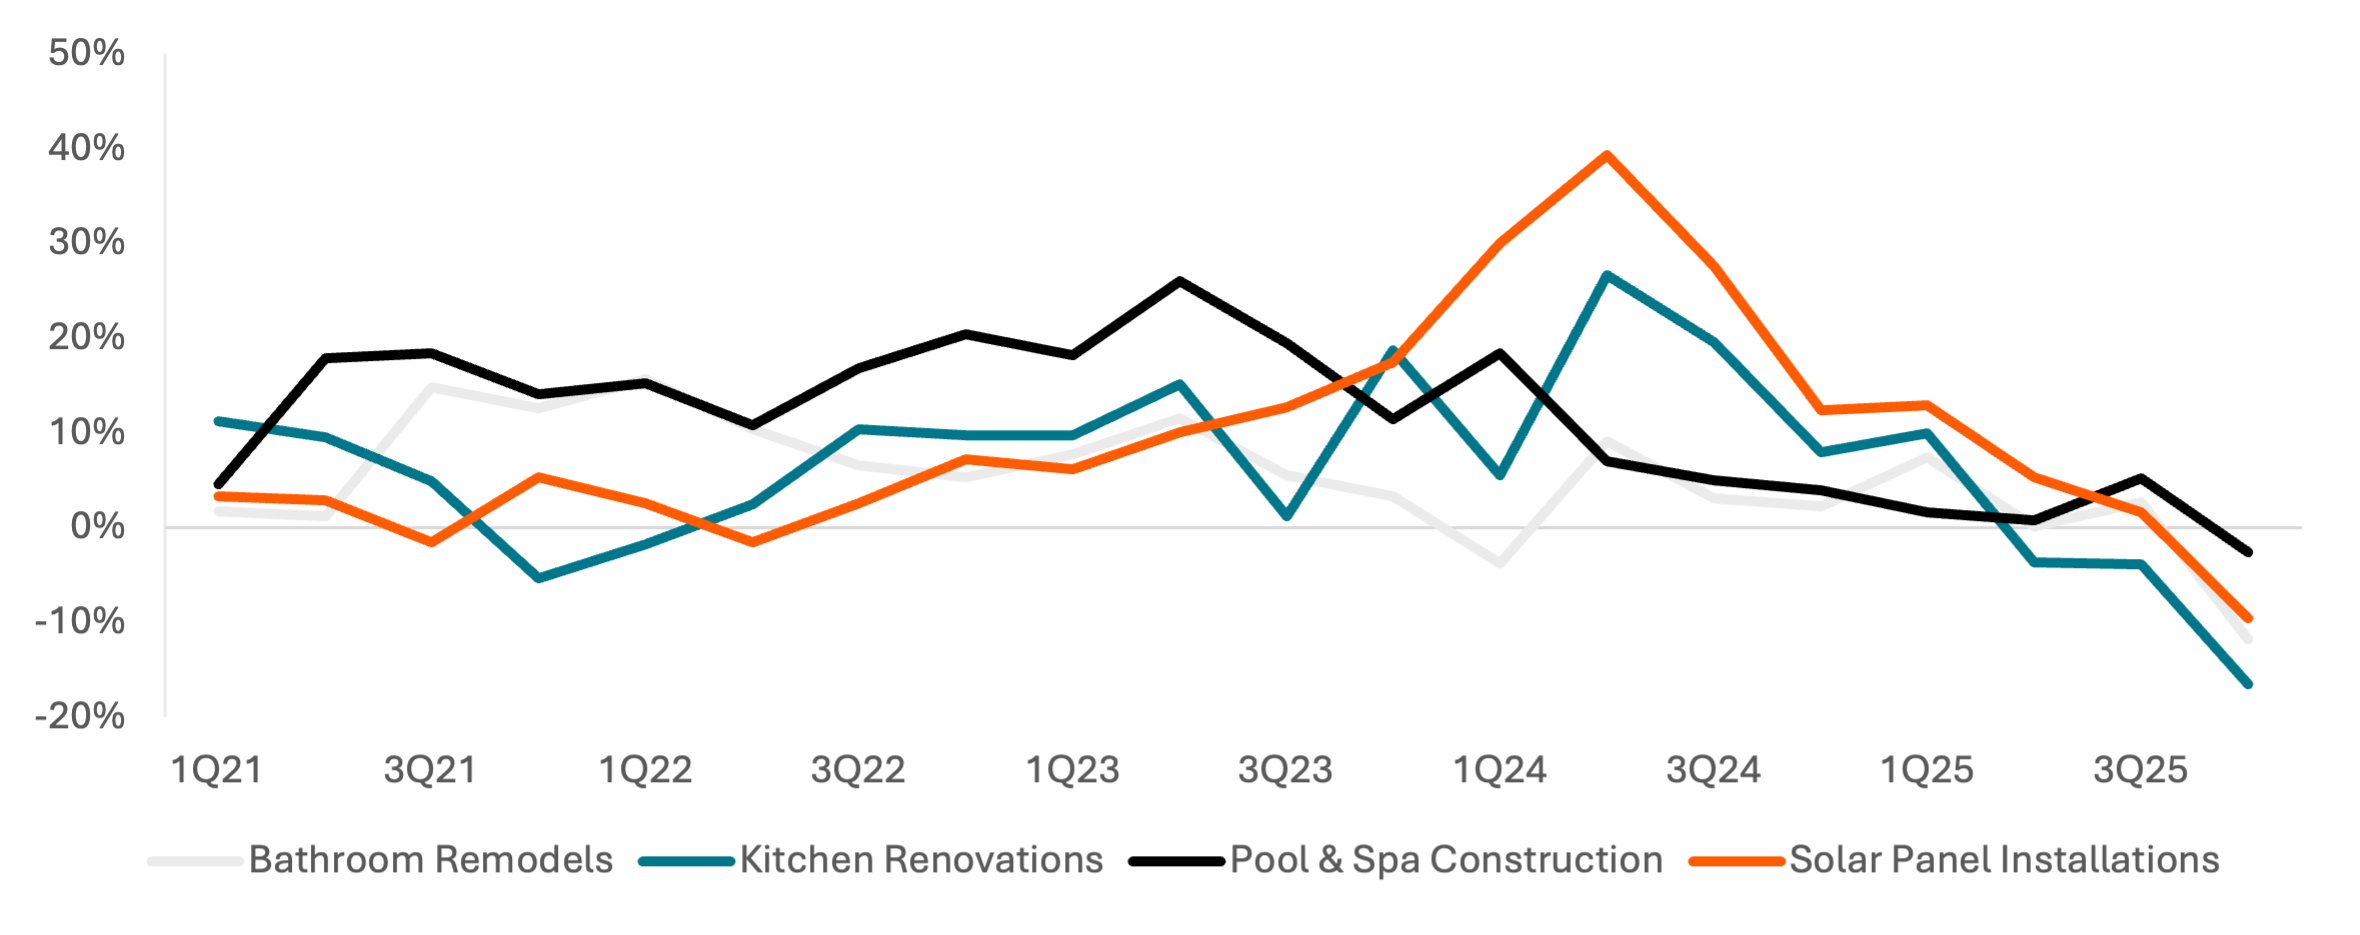
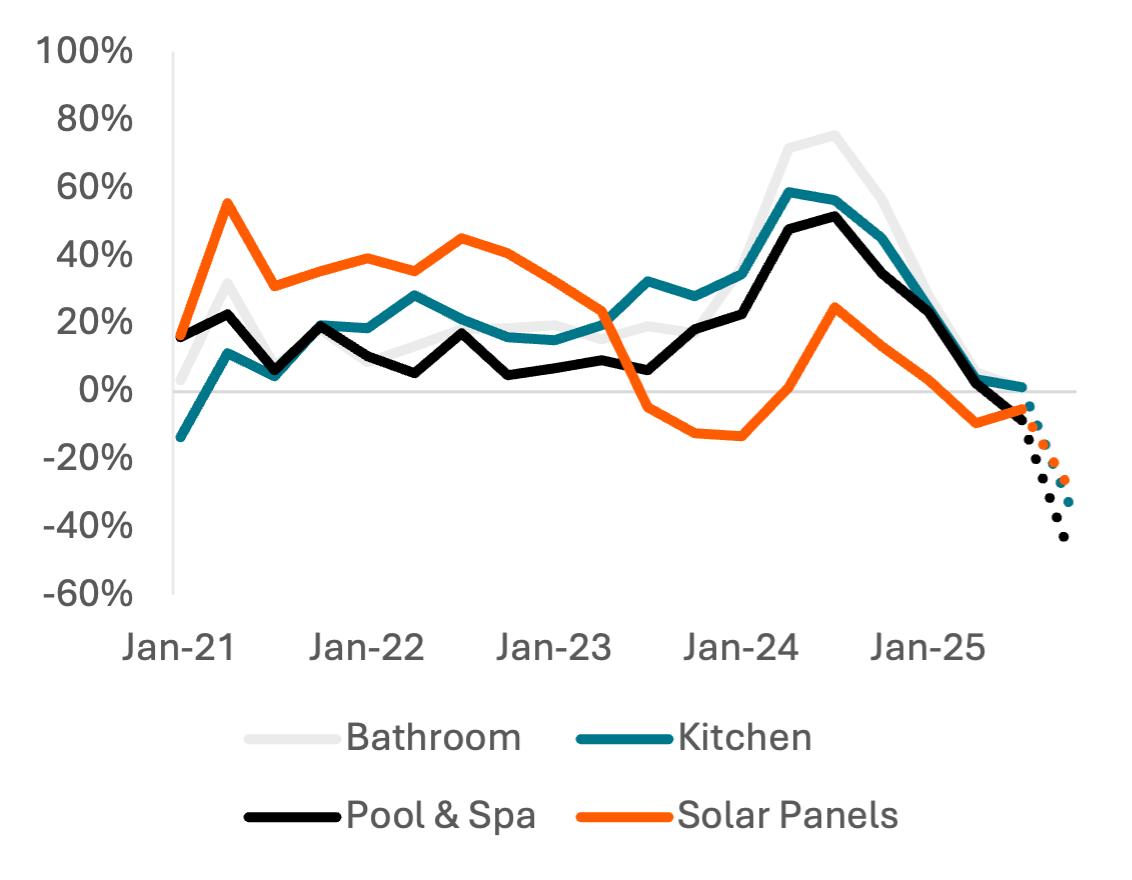
Average job values for the most common home renovations fell 3 – 17% Y/Y nationally in 4Q25, continuing a downward growth trend that began in 3Q24 and showing that consumers are also cutting back on smaller property investments. Pool & Spa construction costs have remained the most stable in 2024-2025 but are showing the greatest Y/Y decline in issued permits 3Q and 4Q25, perhaps due to a lower ability to shrink the size or cost of those renovations. Solar installations increased rapidly during the Biden administration, with slowing growth in 2025 coinciding with the loss of a 30% tax credit on that investment.
While permits from 4Q continue to be reported by the issuing jurisdictions, average job values across these primary renovation types are decreasing Y/Y across the U.S., with the largest declines in coastal regions. Despite sharper home price declines in the East North Central relative to other interior regions, renovation values rose +17% Y/Y in 4Q, driven by increased job values in Pool & Spa Construction and Kitchen Renovations rather than a shift toward higher-priced renovation categories.
Exhibit 7: Average Job Value Y/Y Growth for Issued Renovation Permits
Price: 50.18 Tokens
Exhibit 8: Issued Permit Count Y/Y Growth
Price: 50.18 Tokens
Exhibit 9: 4Q25 Renovation Permit Value Y/Y Growth
Price: 602.04 Tokens
Strong Quarter Entry Keeps HD and LOW in-line with Guidance Despite Post-Holiday Weakness
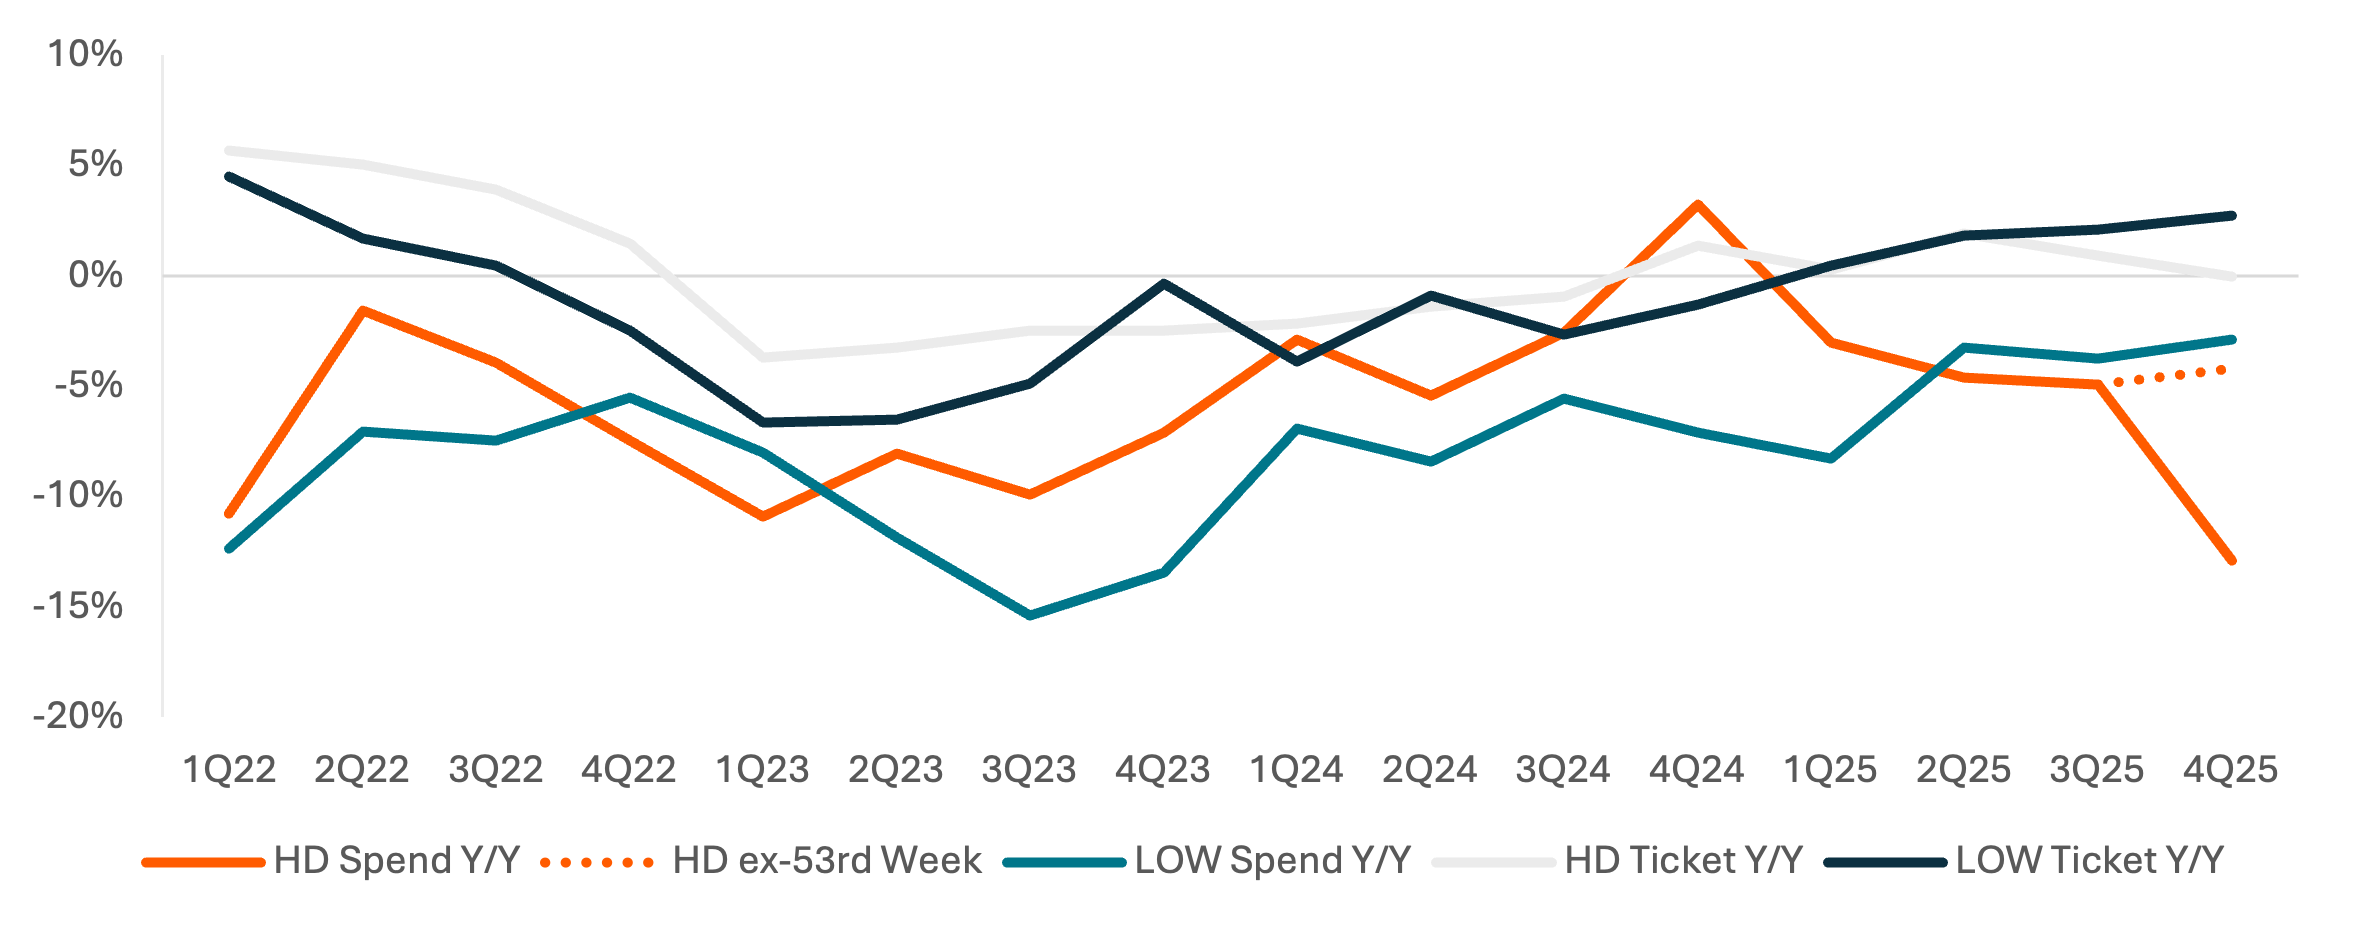
Despite downward momentum in renovations, both Home Depot (HD) and Lowe’s (LOW) show a slight acceleration in credit card spend growth Y/Y, implying U.S. net sales growth of 3-4% and U.S. comparable sales growth of ~1%, in-line with HD’s “slightly positive” and LOW’s “flat” Y/Y guidance for fiscal year 2025 (LOW had a weaker start to 2025). HD’s growth comes despite a more-difficult comp in 4Q24, when U.S. comp sales rose from -3 - -4% to -1.2%.
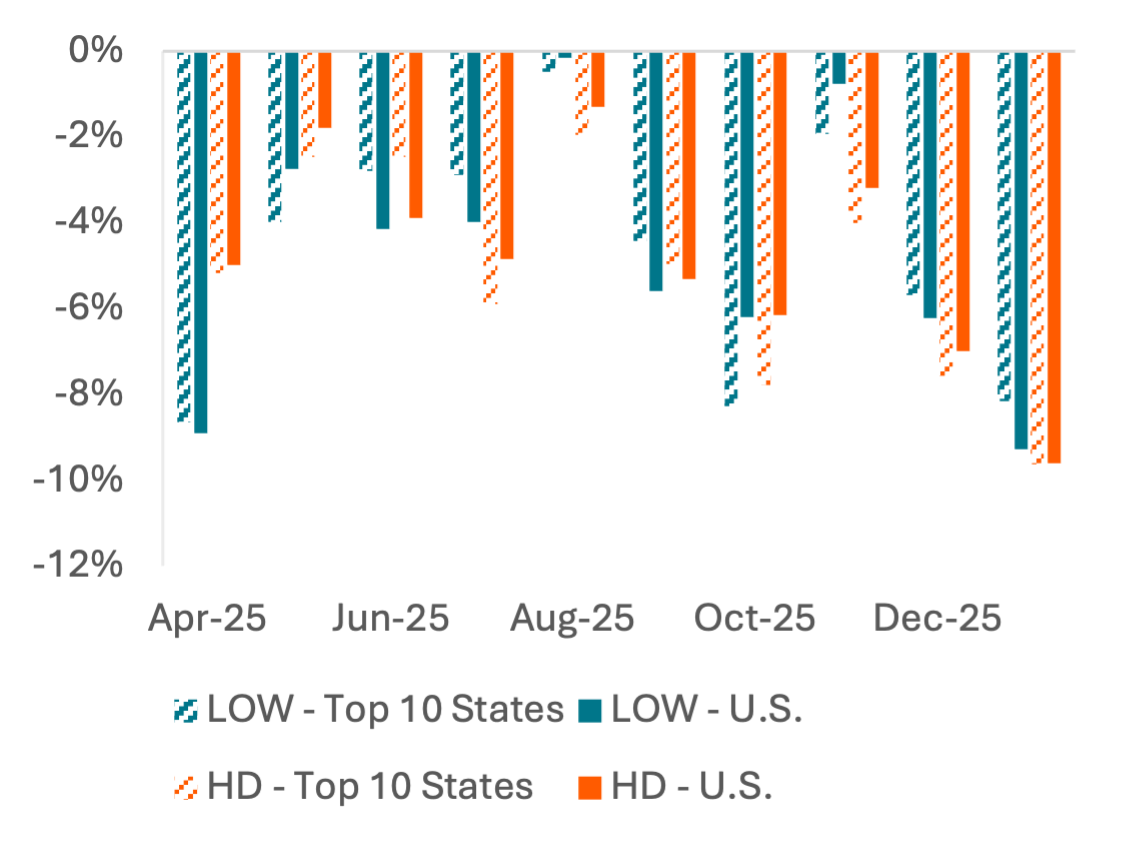
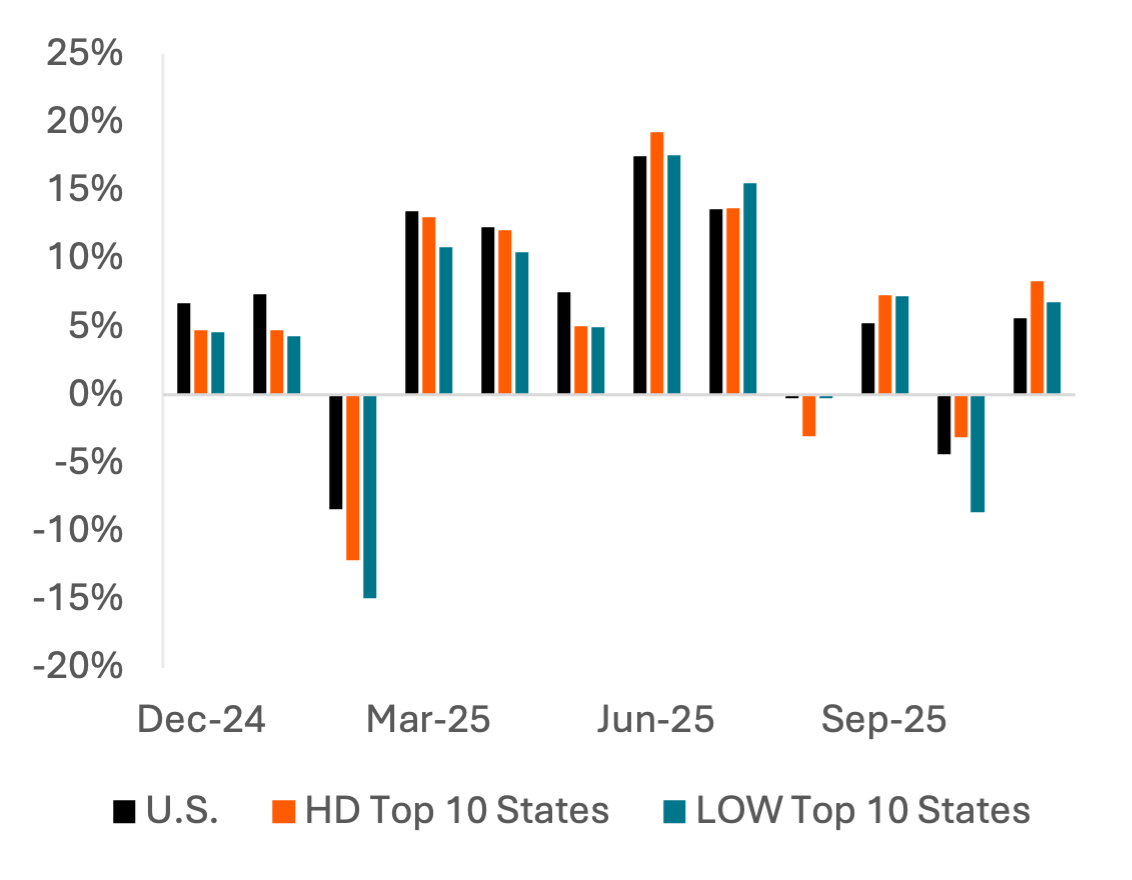
However, credit card spend growth has softened since the early part of 4Q and the companies’ mid-November earnings calls. MTD growth in January is at a 9-month low from a sharp negative inflection post-Christmas; HD spend growth was -10% Y/Y in the 14 days after Christmas vs. -4% in the preceding 14 days. HD has become increasingly reliant on its newer or smaller markets for spend growth, while Lowe’s spend growth is currently stronger in its top 10 states by stores, including key homebuilding markets like California, Texas, and Florida.
Exhibit 10: Home Depot and Lowe’s Credit Card Spend Growth Y/Y
Price: 50.52 Tokens
Exhibit 11: Constant Shopper Panel Spend 14-Day Moving Average, Y/Y Growth
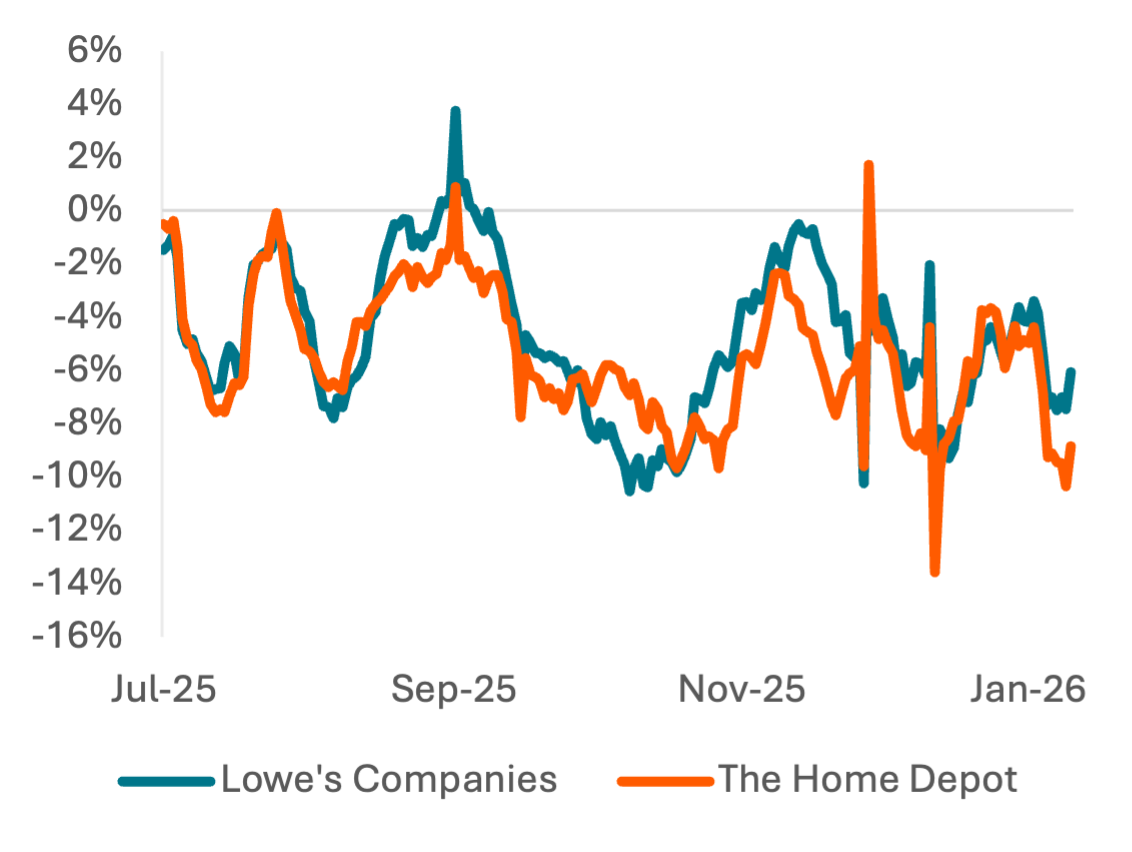
Price: 7.70 Tokens
Exhibit 12: Monthly Spend Y/Y Growth, Top 10 States (by Stores) vs. U.S.
Price: 131.82 Tokens
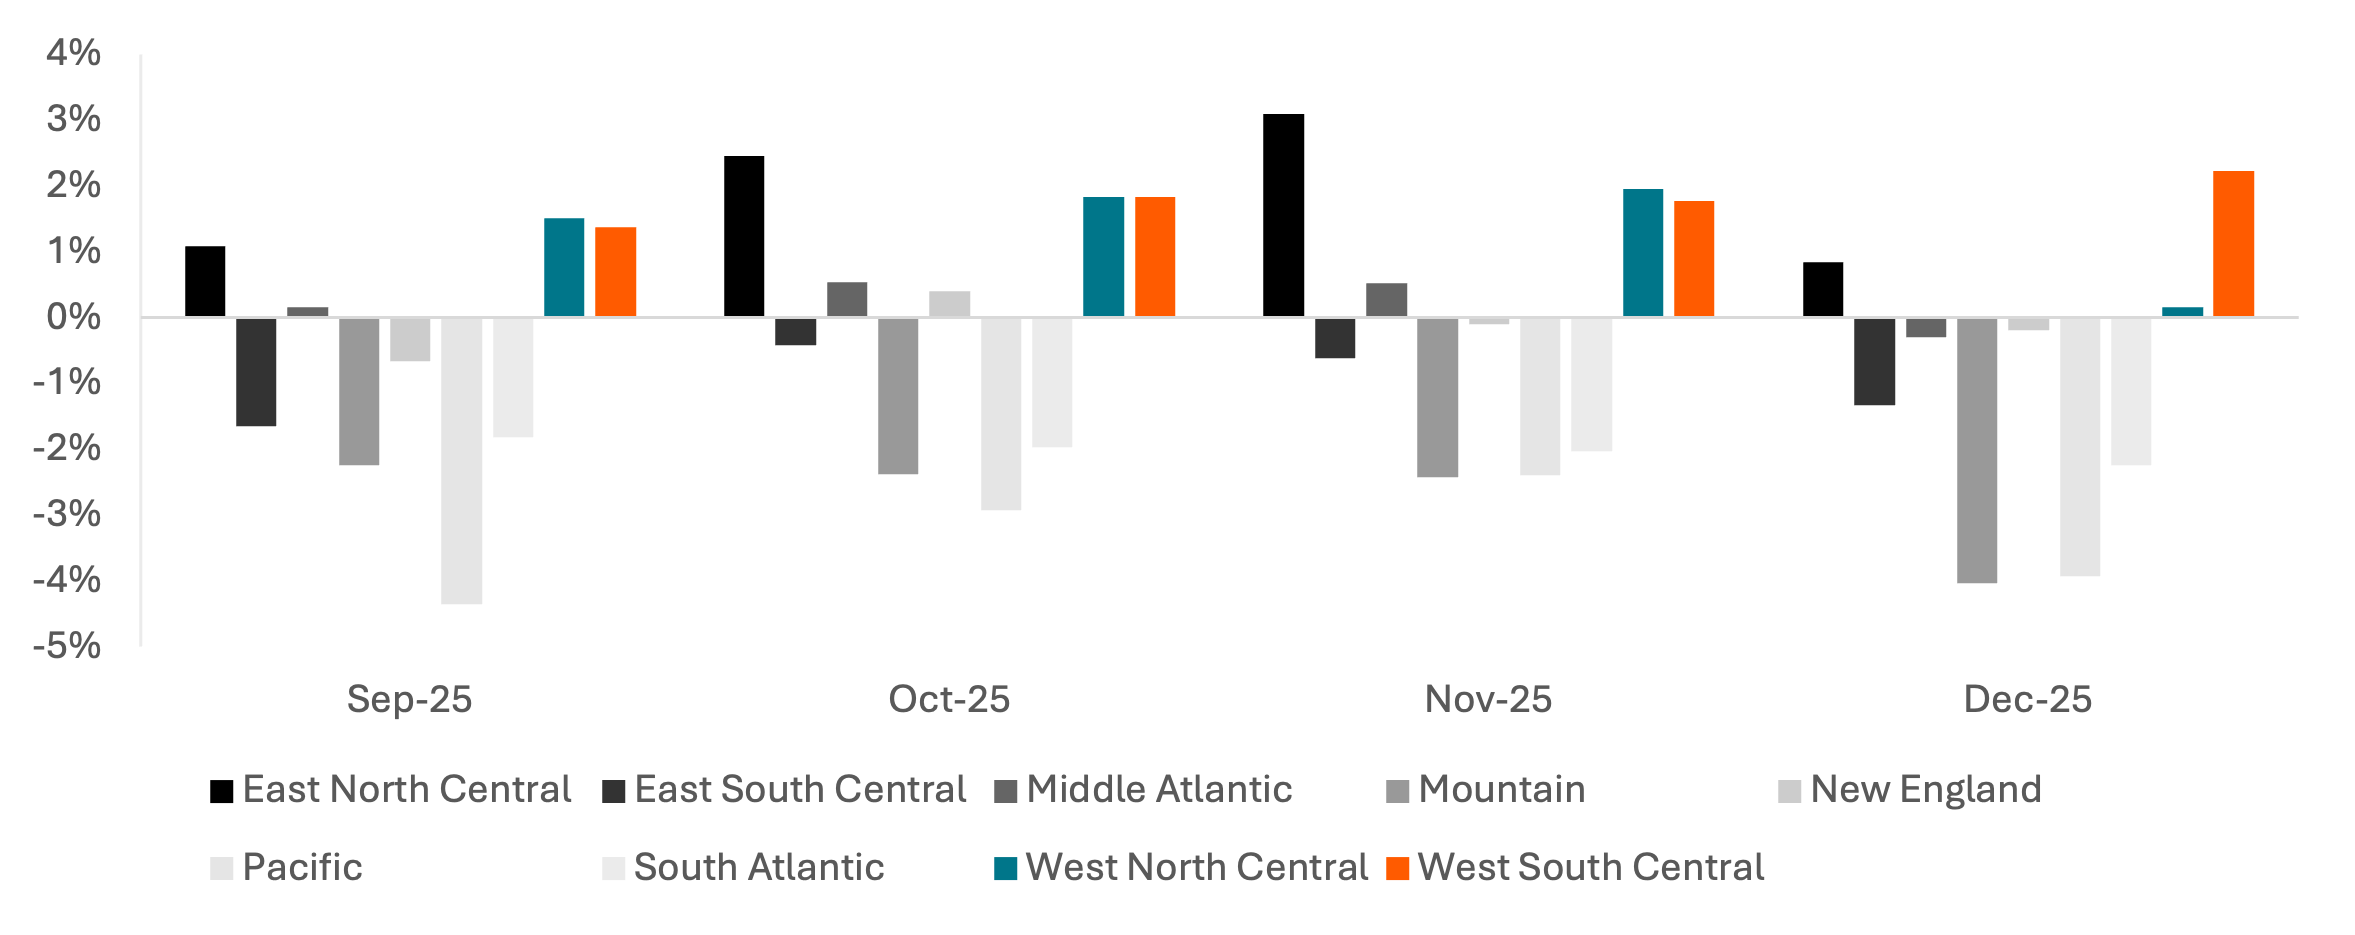
SMB Construction Employment Falling Y/Y, Weakness Strongest in West
Following relatively-stable SMB construction employment levels in October and November, employment plunged to a 10-month low in December 2025, with Y/Y growth of -1.4% also a new low. December’s job losses M/M primarily occurred in the Midwest (East North Central and West North Central) and western (Mountain and Pacific) regions. Despite the deceleration, construction jobs were still up Y/Y in the Midwest and West South Central. Employment growth Y/Y was most stable in southern regions, suggesting winter weather may be impacting employment earlier than it did a year ago.
Pickup truck registrations are another useful indicator for construction and contractor employment, as well as balance sheet strength for consumers in key regions for homebuilding and home improvement. Registrations increased Y/Y in September and November despite downward pressures from employment and renovation activity.
Exhibit 13: SMB Construction Employment Y/Y Growth by Region
Price: Requires row-level block data access, available on request
Exhibit 14: SMB Construction Employment, U.S.

Price: Requires row-level block data access, available on request
Exhibit 15: New Pickup Truck Registration Y/Y Growth
Price: 12.75 Tokens
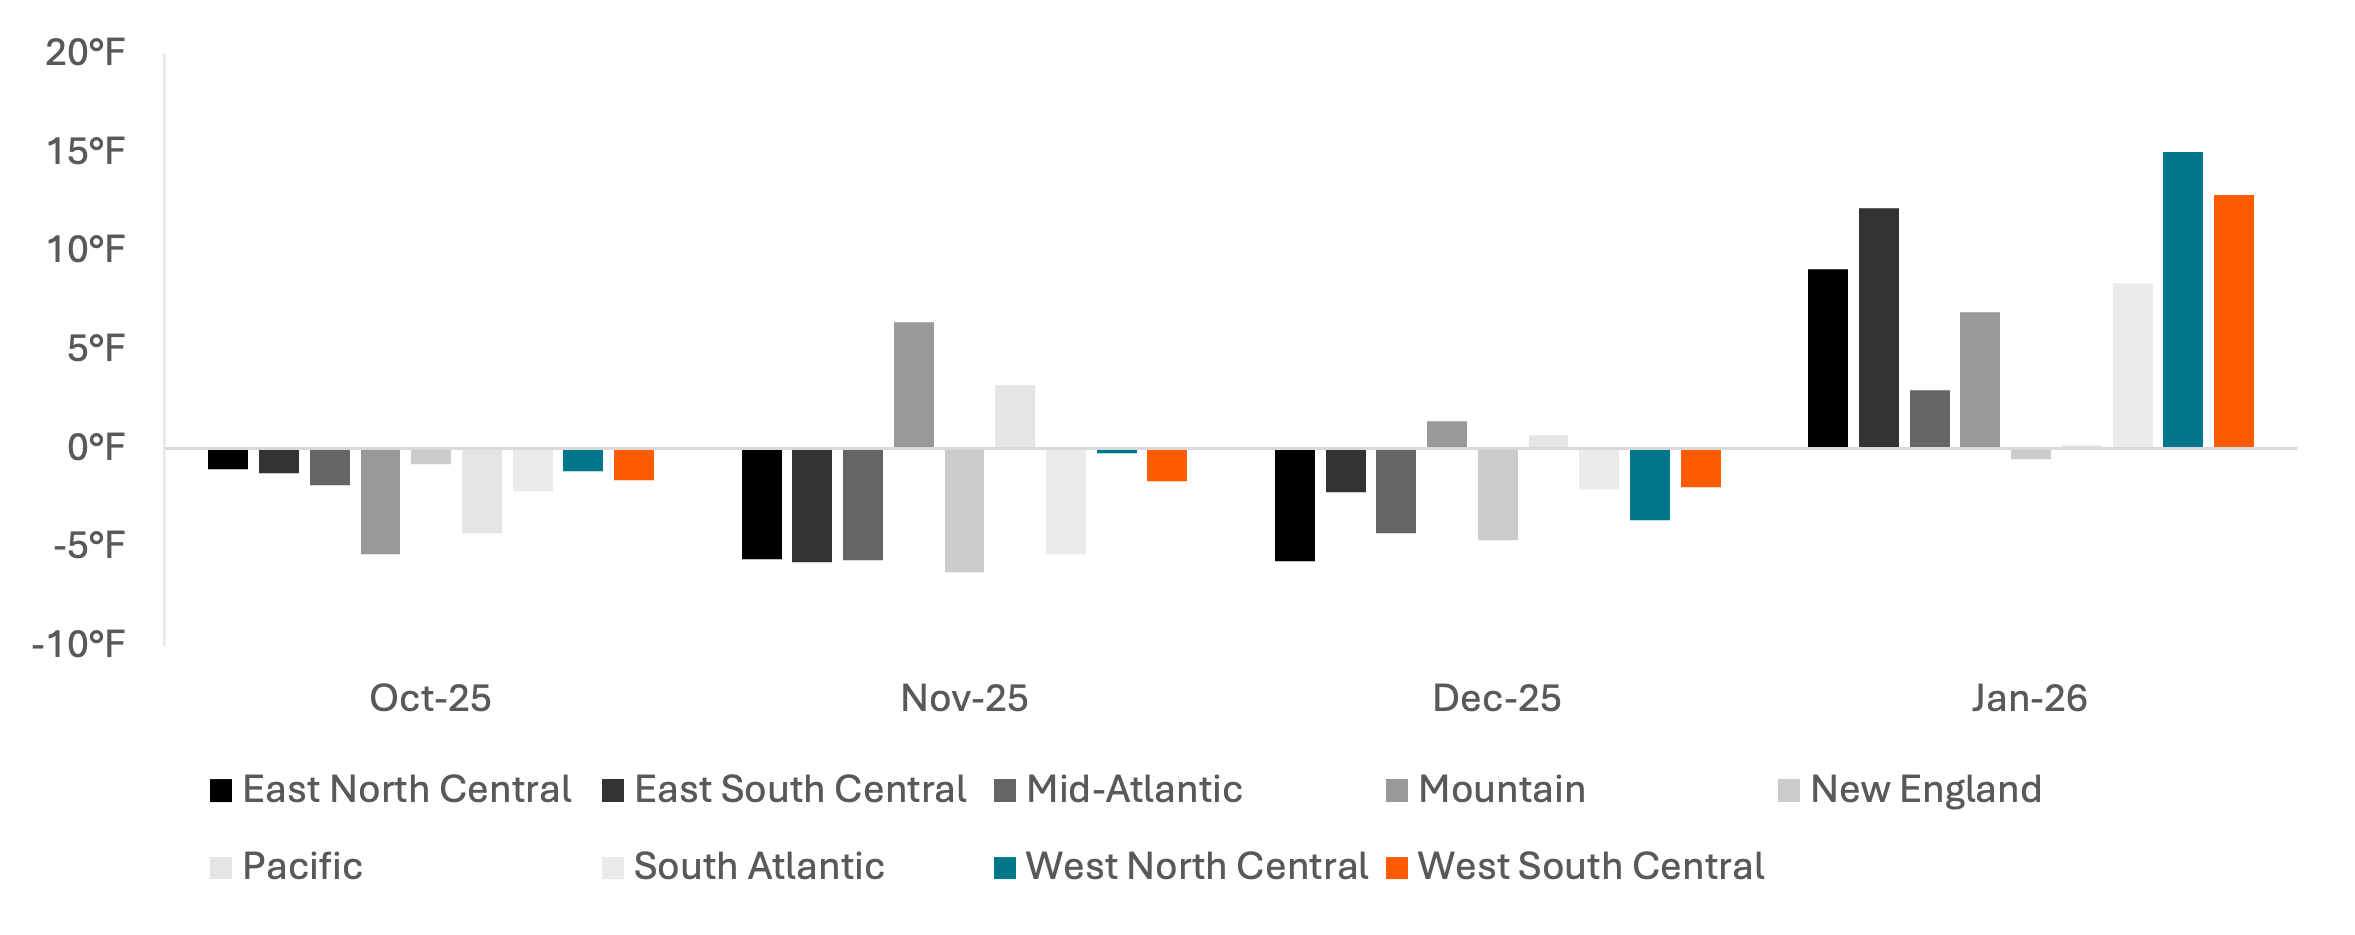
Drier, Warmer Winter Could Boost Construction Following Colder Fall
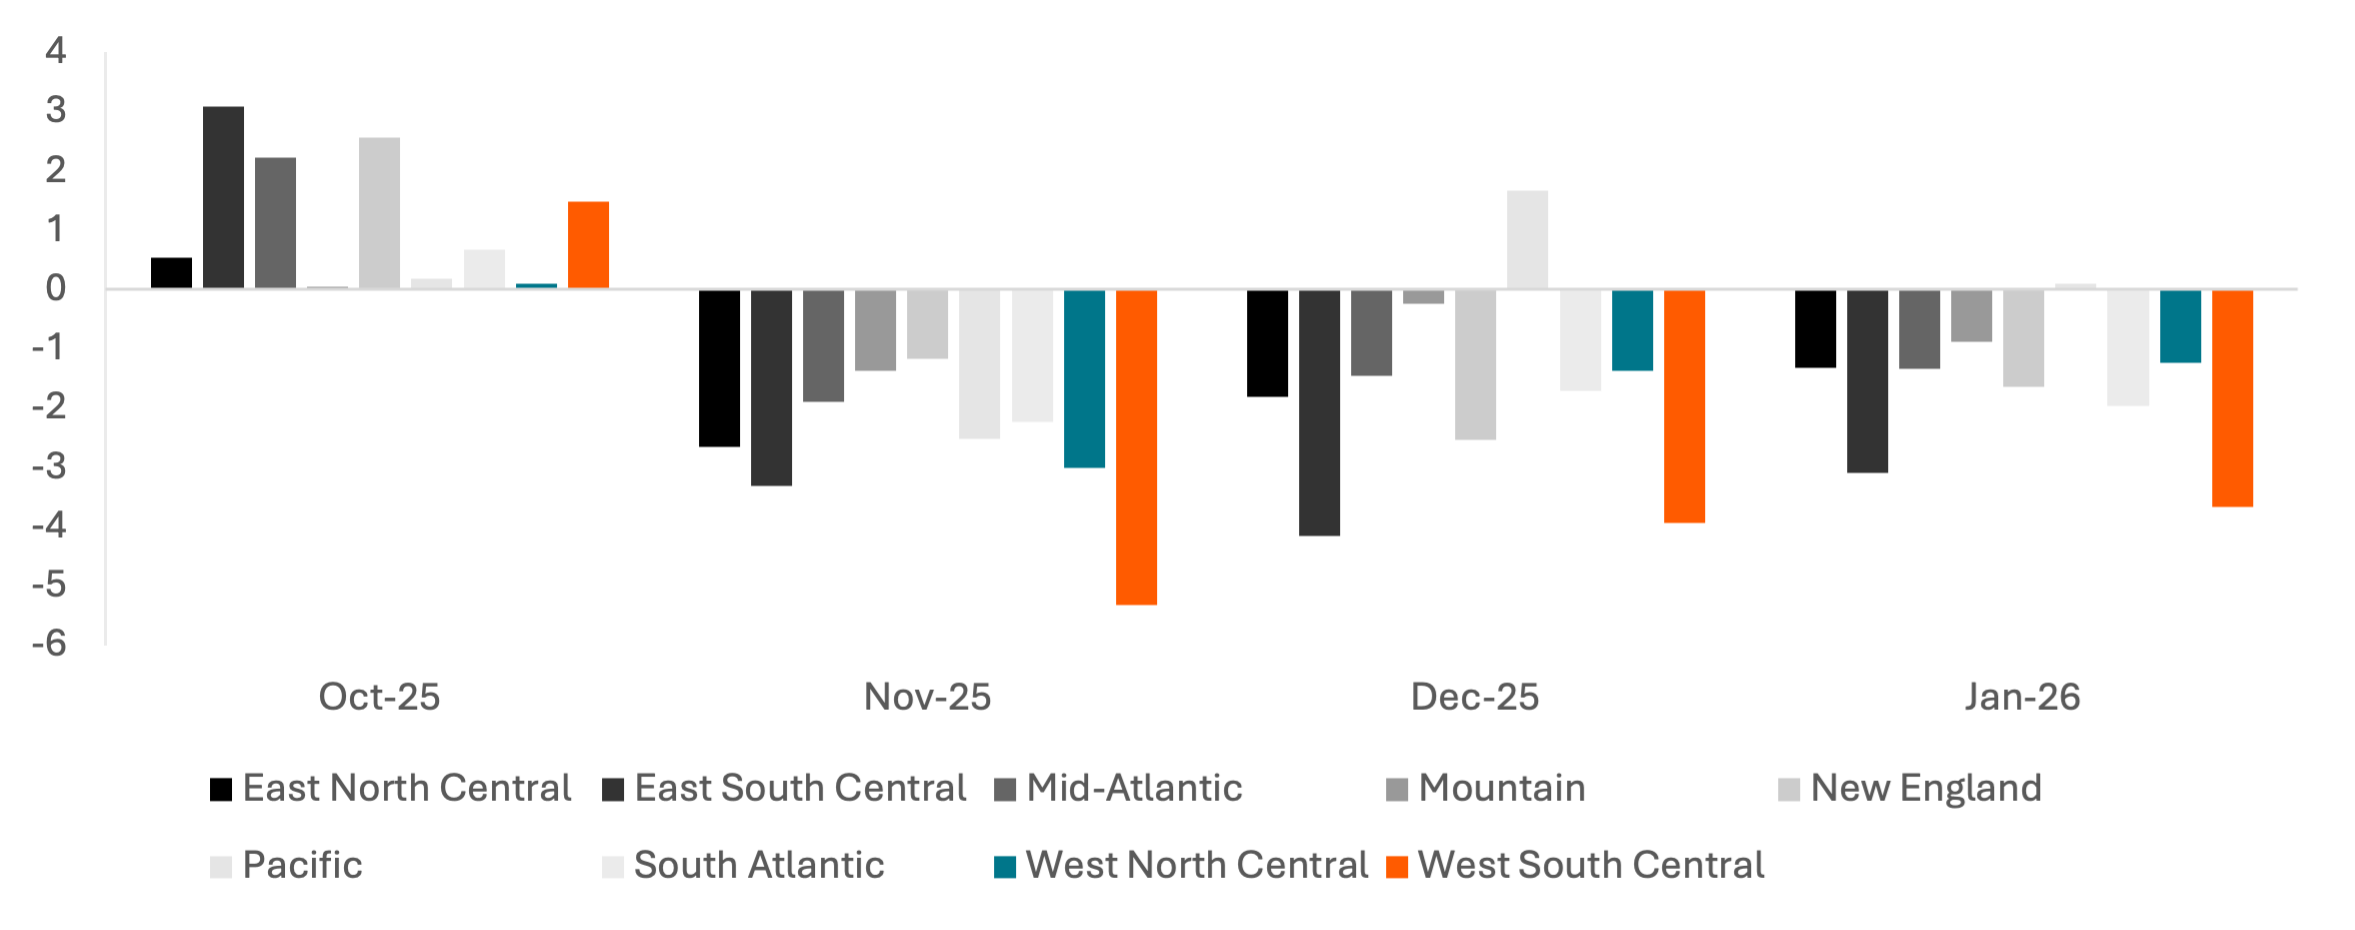
In-line with its deceleration in construction employment, December temperatures in the East North Central were 6 degrees cooler than in 2024, the largest Y/Y decrease in the country. The cooler November and December 2025 temperatures were accompanied by lower rainfall, which would limit the negative impacts on home improvement and construction. October was both colder and wetter in 2025 than 2024 and coincided with the weakest month in FY2Q – FY3Q for both Home Depot and Lowe’s.
January weather has been warmer across most of the country, particularly in central regions, and has been drier everywhere except the Pacific region. Home Depot and Lowe’s MTD sales growth hitting a recent low, despite the improved weather, is a warning sign for home improvement and renovations more broadly.
Exhibit 16: Average Y/Y Temperature Change (ºF) by Region
Price: 157.1 Tokens
Exhibit 17: Average Y/Y Precipitation Change (in.) by Region
Price: 157.1 Tokens
References
-
The Wall Street Journal. “U.S. Home Prices Keep Slow Growth Pace.” The Wall Street Journal, December 15, 2025. https://www.wsj.com/economy/housing/u-s-home-prices-keep-slow-growth-pace-0b09966a
-
Bloomberg News. “U.S. Housing Starts Fall to Lowest Level Since May 2020.” Bloomberg, January 9, 2026. https://www.bloomberg.com/news/articles/2026-01-09/us-housing-starts-fall-to-lowest-level-since-may-2020
-
Federal Reserve Bank of St. Louis. “30-Year Fixed Rate Mortgage Average in the United States (MORTGAGE30US).” FRED, Federal Reserve Bank of St. Louis, accessed January 15, 2026. https://fred.stlouisfed.org/series/MORTGAGE30US
-
Lennar Corporation. “Lennar Reports Fourth Quarter and Full Year 2025 Results.” Lennar Investor Relations, December 16, 2025. https://investors.lennar.com/press-releases/2025/12-16-2025-213022894
-
Federal Reserve Bank of St. Louis. "Median Sales Price of Houses Sold for the United States (MSPUS)." FRED, Federal Reserve Bank of St. Louis, accessed January 16, 2026. https://fred.stlouisfed.org/series/MSPUS
Questions?
Contact us at support@carbonarc.co if you have any questions!
CARARC-20260120-HOUSING-0001