Sector Spotlight
Carbon Arc Data Assets: Credit Card – US Complete Panel, Credit Card – US Detailed Panel, Clickstream, POS – Premium Culinary Retail
Spending Wanes as Consumers Make Trade-Downs from Higher Prices
March 10, 2026
Executive Summary
Consumer confidence struggled in 2025, driven by high prices, tariffs, and stagnant employment growth1, but economic data suggests higher-income Americans are less impacted23. While many point-of-sale datasets highlight mass merchandisers, grocery stores, and other suppliers of consumer staples, Carbon Arc's POS – Premium Culinary Retail dataset provides a look into the spending habits, behavior changes, and confidence of the high-income consumer.
Waning consumer confidence is well-established by significant declines in spending on home furnishing retail and cutbacks in leisure spend, which were most emphatic early in the year before shifting negative towards the beginning of 2026. Spend in February is particularly weak but coincides with significant winter storms. Consumers have been trading down from Breville throughout the last year but largely from its less-expensive products, indicative of a K-shaped economy. Tariffs also show a strong impact on consumer behavior; as All-Clad and GreenPan raised prices in 2025, Le Creuset and Staub gained market share in cookware.
Key Takeaways
-
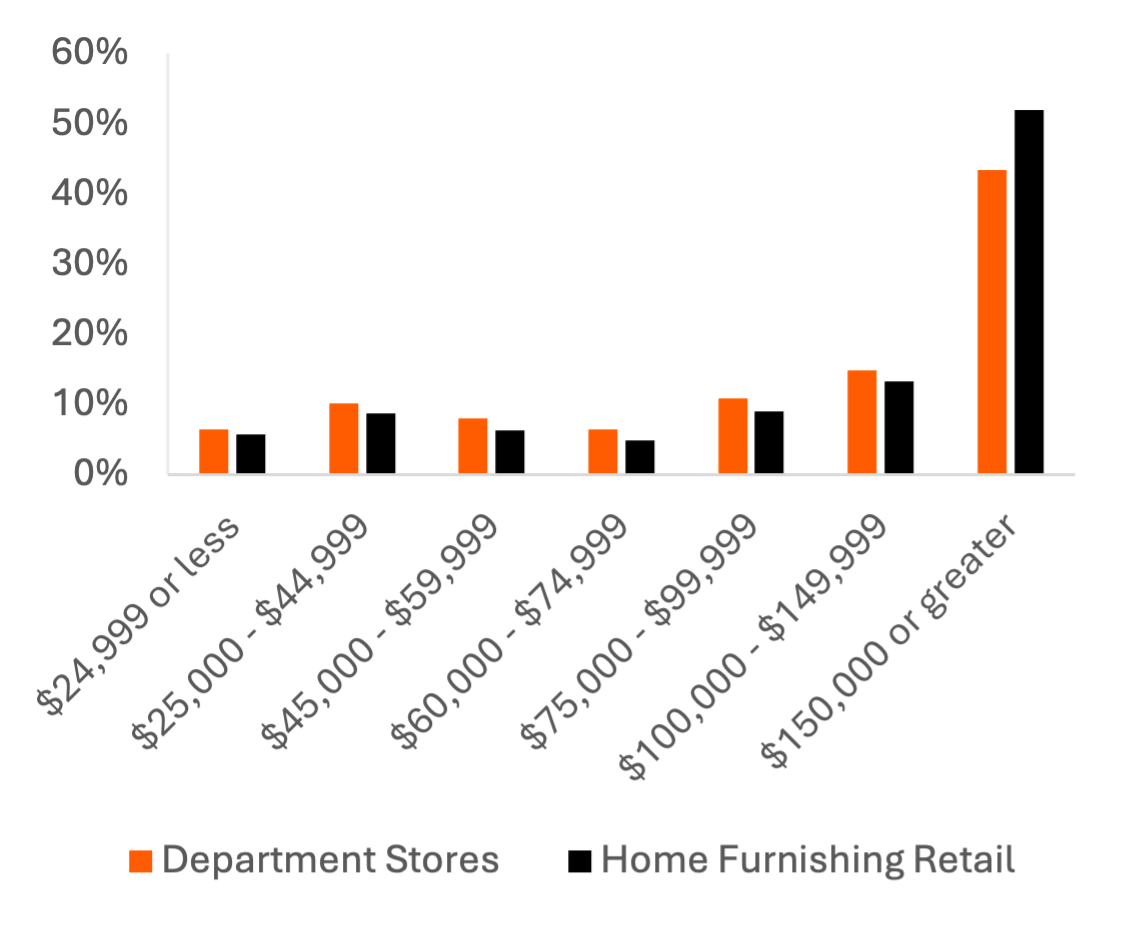
52% of spend on home furnishing retail and 43% of spend at department stores comes from consumers making $150,000 or more per year; consumers of high-end cookware are more likely to use LinkedIn and subscribe to smaller streaming services like Apple TV and Peacock.
-
Average item purchase prices are up year-over-year across categories but show evidence of consumers purchasing fewer cookware and electronic products relative to lower-priced categories.
-
Breville is losing market share to lower-cost kitchen appliance brands like Cuisinart and Kitchenaid, despite a lack of price increases. Average transaction value for Breville is increasing, indicating consumers are purchasing its highest-priced products and trading away from its less-premium items.
-
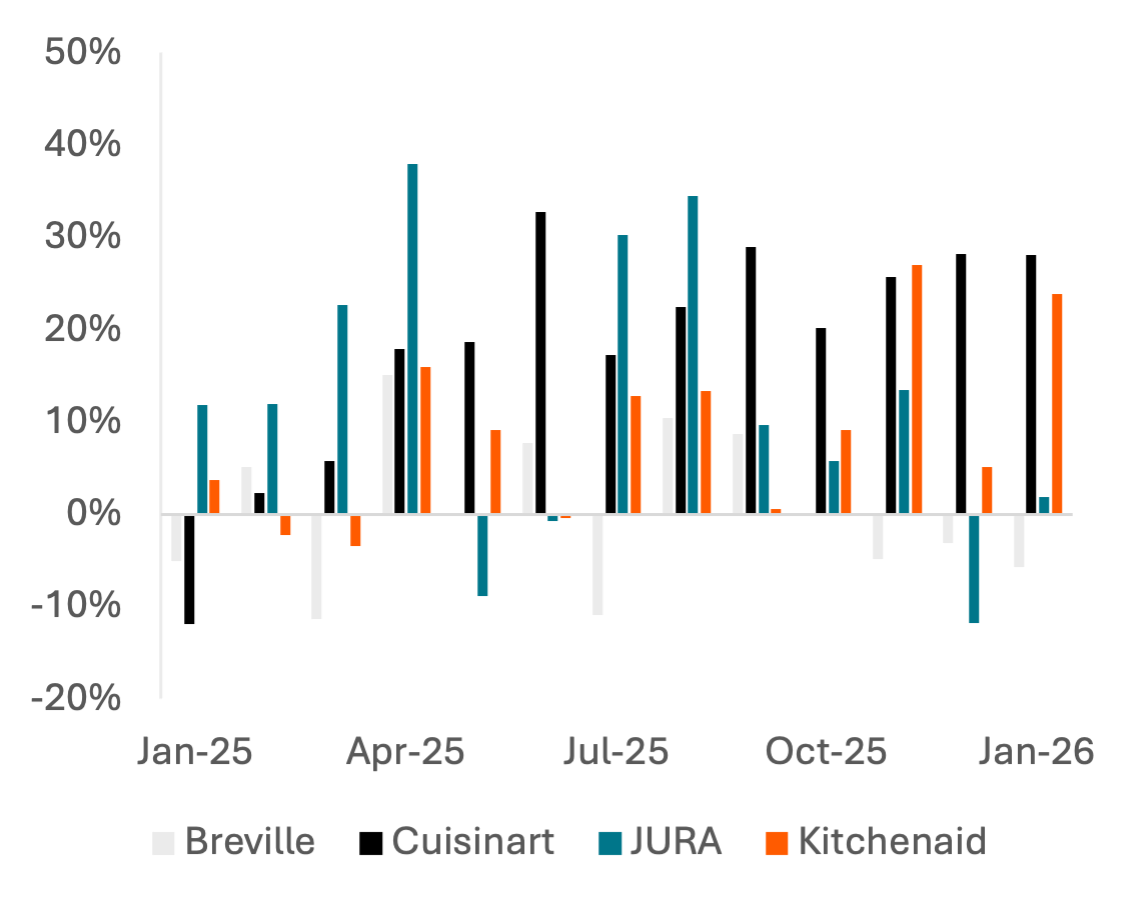
Kitchenaid, Cuisinart, and JURA raised average price per SKU by up to 27%, 33%, and 38%, respectively, in the months following the April 2025 announcement of tariffs on U.S. imports.
-
All-Clad and GreenPan lost market share in cookware to Le Creuset and Staub as they increased prices in response to tariffs on China, which impacted steel prices for All-Clad4 and GreenPan's imports from its factory in Jiangmen5.
-
Consumer leisure spending showed a negative inflection in February 2026, against easy comps, to continue a weak winter. Card spend growth across leisure brands peaked in October 2025 but has stayed negative across brands since then. Data on culinary classes shows positive growth in November-December, but a similar negative inflection in January.
The High-End Cookware Consumer
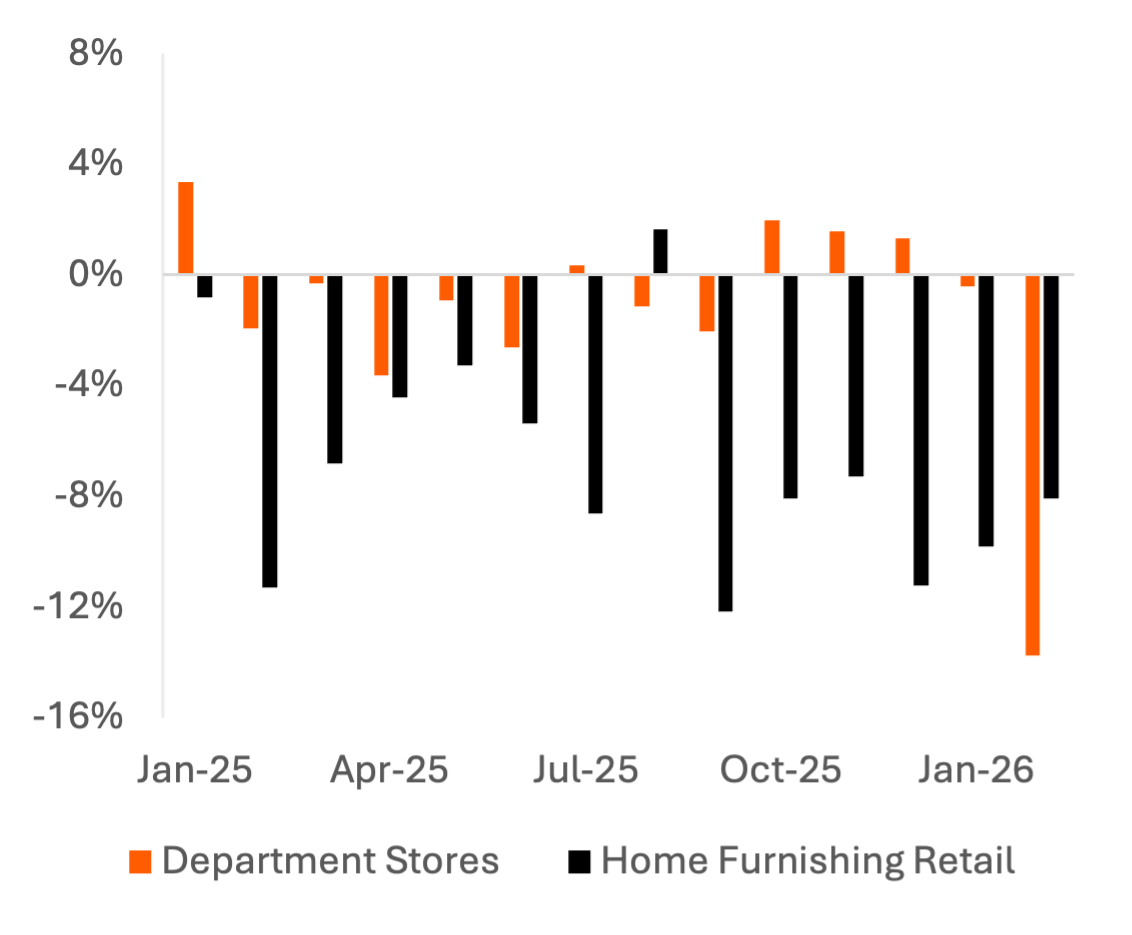
Cohort spend data at department stores and home furnishing stores, which includes retail brands like Crate & Barrel, shows a significant bias towards high-income consumers. 52% of spend at Home Furnishing Retail comes from consumers making $150,000 or more, and 65% from consumers making $100,000 or more. Spend at department stores, which also includes lower-cost consumer necessities like clothing, shows only slightly less bias towards the highest-income cohorts. These consumers have been cutting back spend; spend on home furnishings retail was down 8-12% in most months of 2025 and into early 2026.
Spend at department stores also fell heavily in February after ~flat to positive Y/Y growth the prior four months, driven by severe winter storms along the east coast.
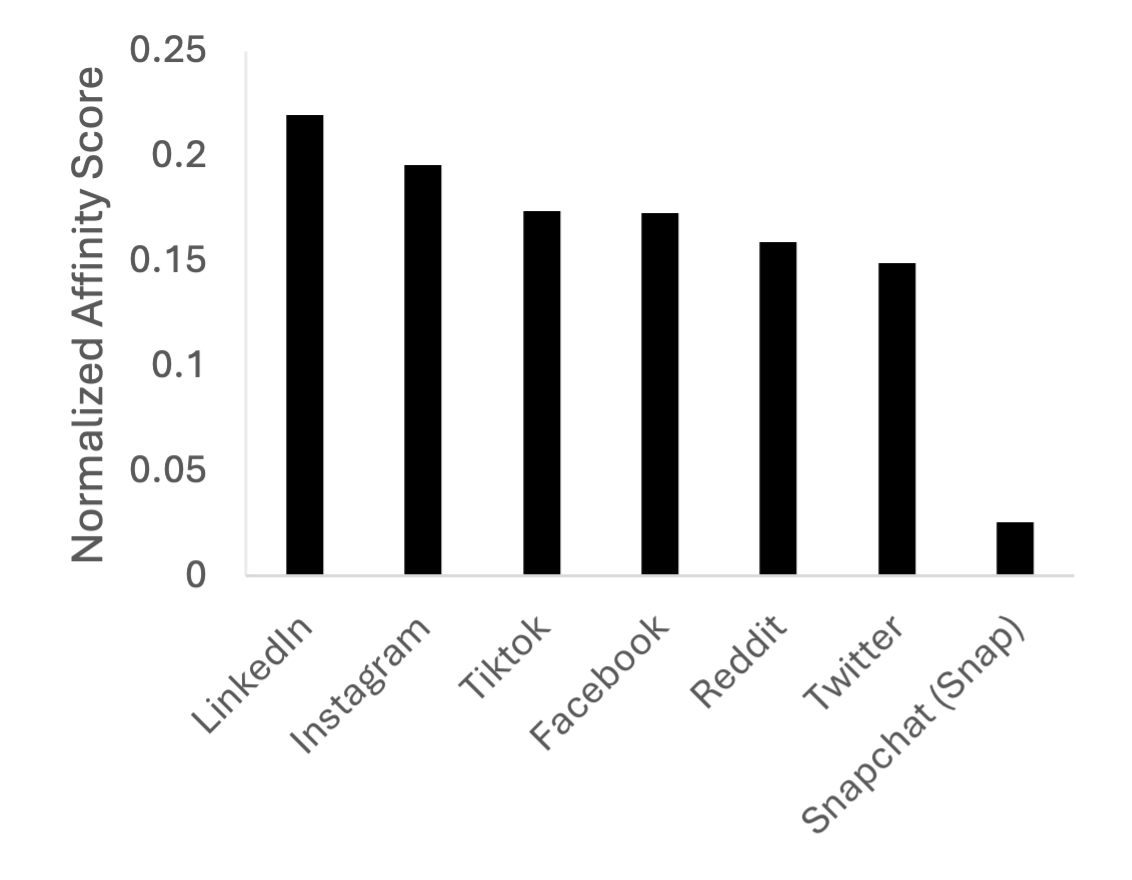
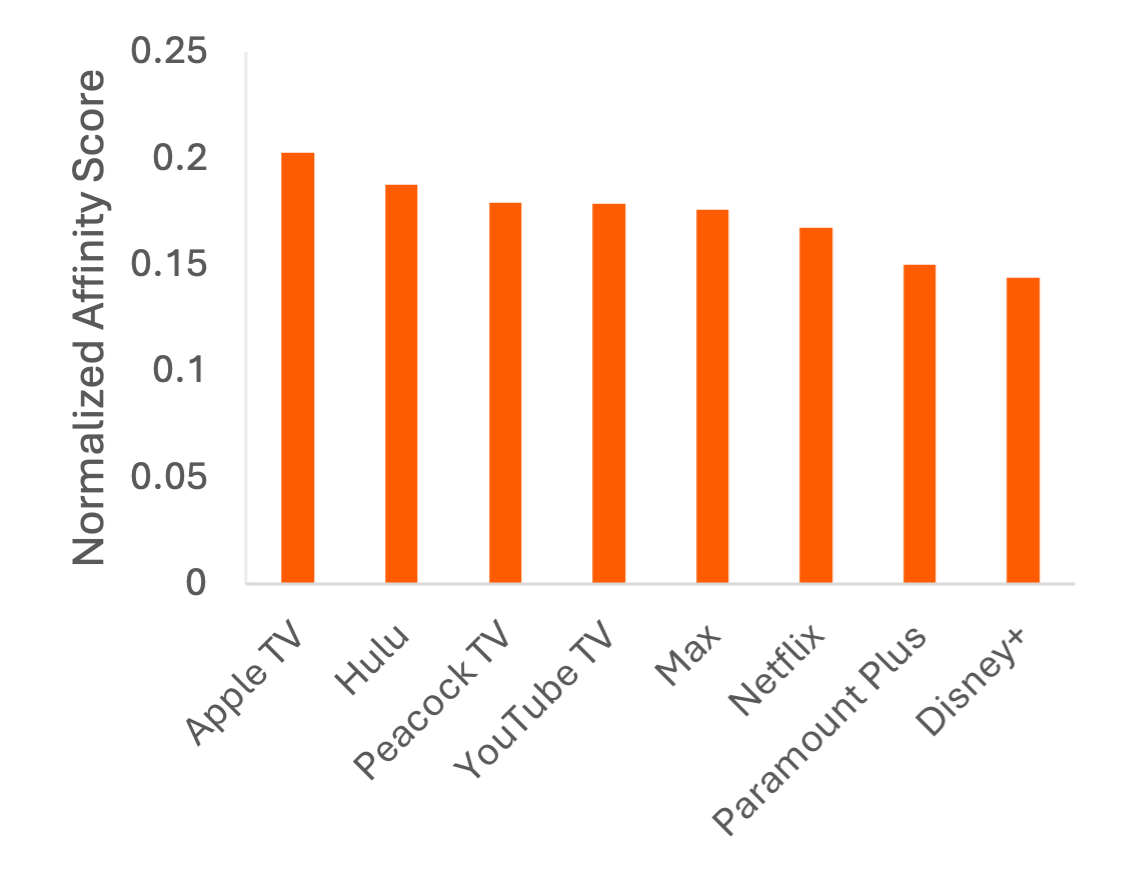
Web affinity further suggests a bias towards professional, high-income consumers. Williams-Sonoma web visitors have a greater affinity for LinkedIn than for other social media networks and are more likely to subscribe to smaller or less-popular streaming services like Apple TV and Peacock. They also skew towards trendier social media platforms like Instagram and TikTok compared to the average American.
Exhibit 1: Credit Card Spend Y/Y Growth
Price: 4.99 Tokens
Exhibit 2: 2025 Spend Share by Income Cohort
Price: 110.04 Tokens
Exhibit 3: Williams-Sonoma Web Visitors Affinity Score
Price: 4.99 Tokens
Exhibit 4: Williams-Sonoma Web Visitors Affinity Score
Price: 4.99 Tokens
Average Item Prices Show Shifts to Cheaper Items and Product Categories
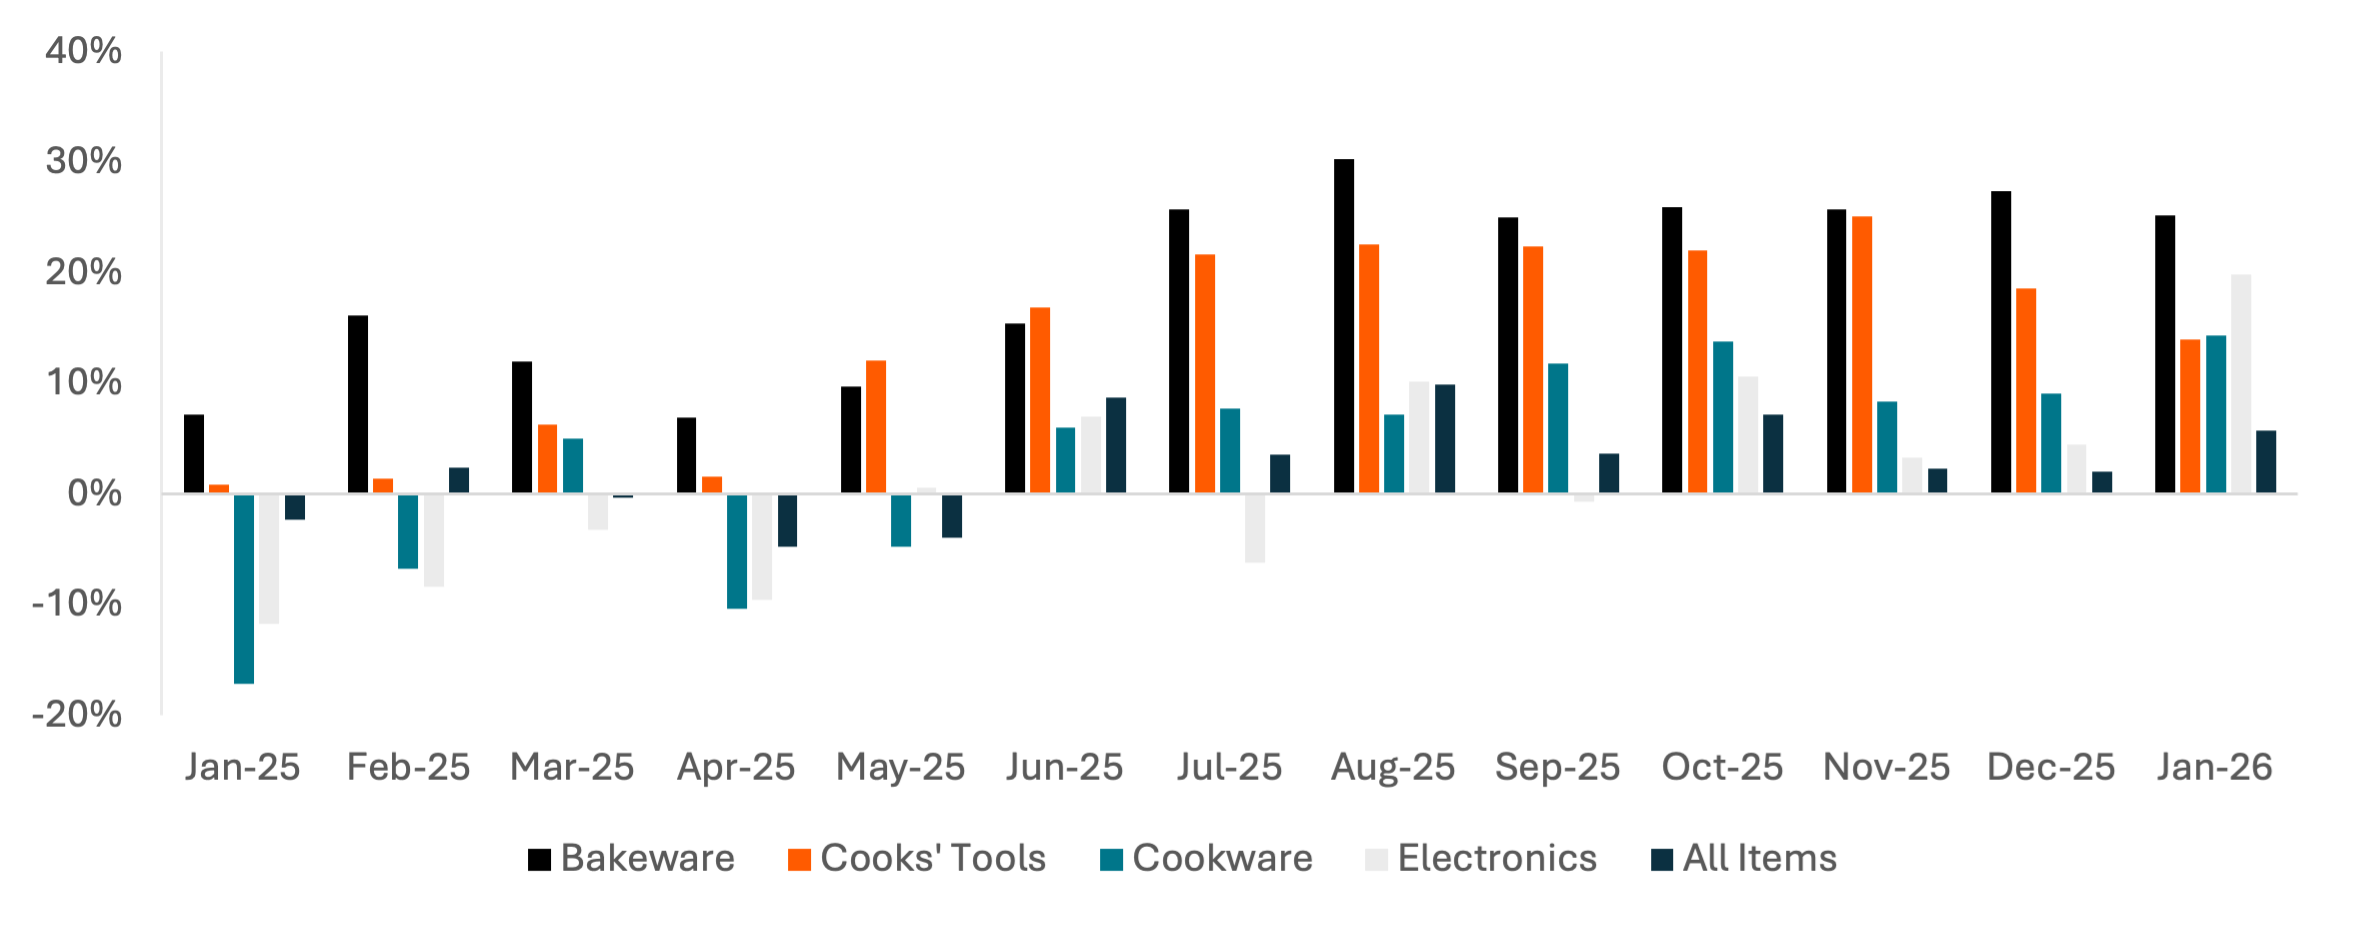
Average purchase prices for premium culinary products increased slightly year-over-year (Y/Y) in 2H25, peaking at 10% Y/Y in August. Prices for each major product category increased more-rapidly, however, indicating consumers are changing their product mix to lower-cost categories like bakeware and cooks' tools and away from larger cookware items and electronics (kitchen appliances). The greater purchase price increases for bakeware and cooks' tools could be driven by consumers used to purchasing higher-priced items bringing a larger budget to these lower-priced categories.
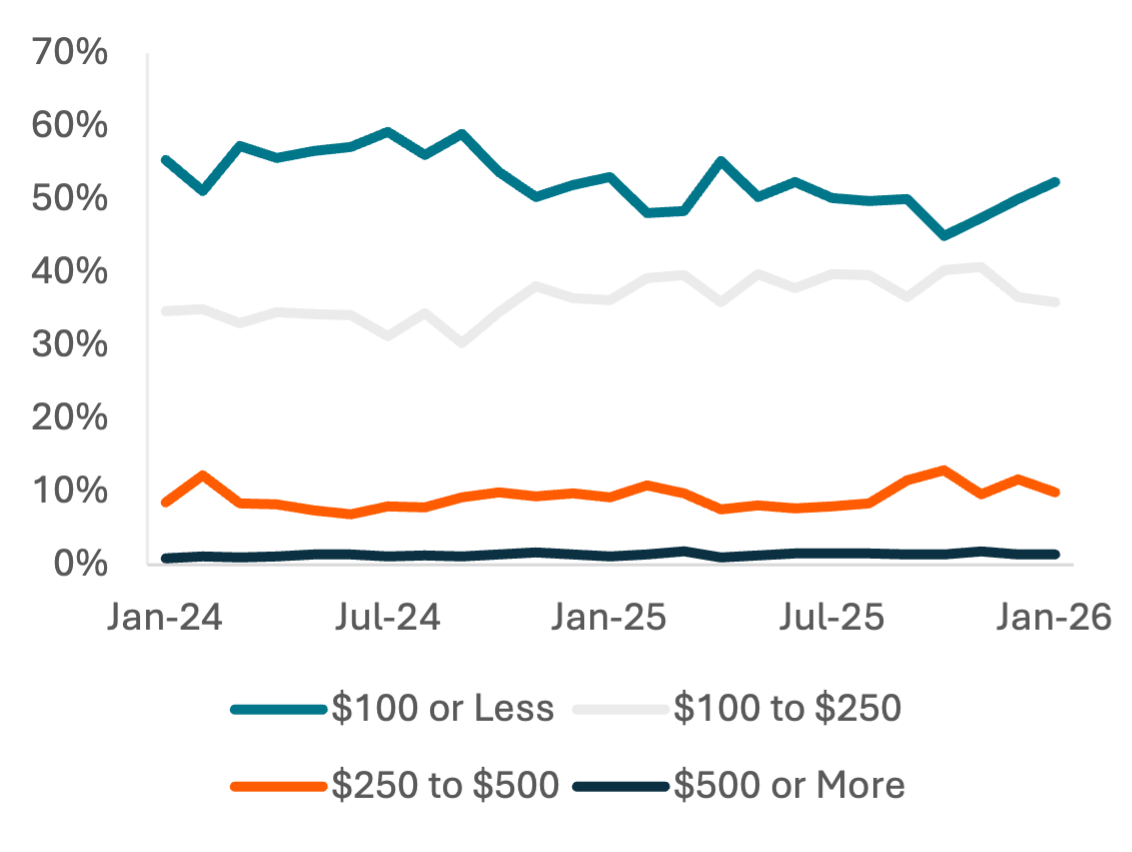
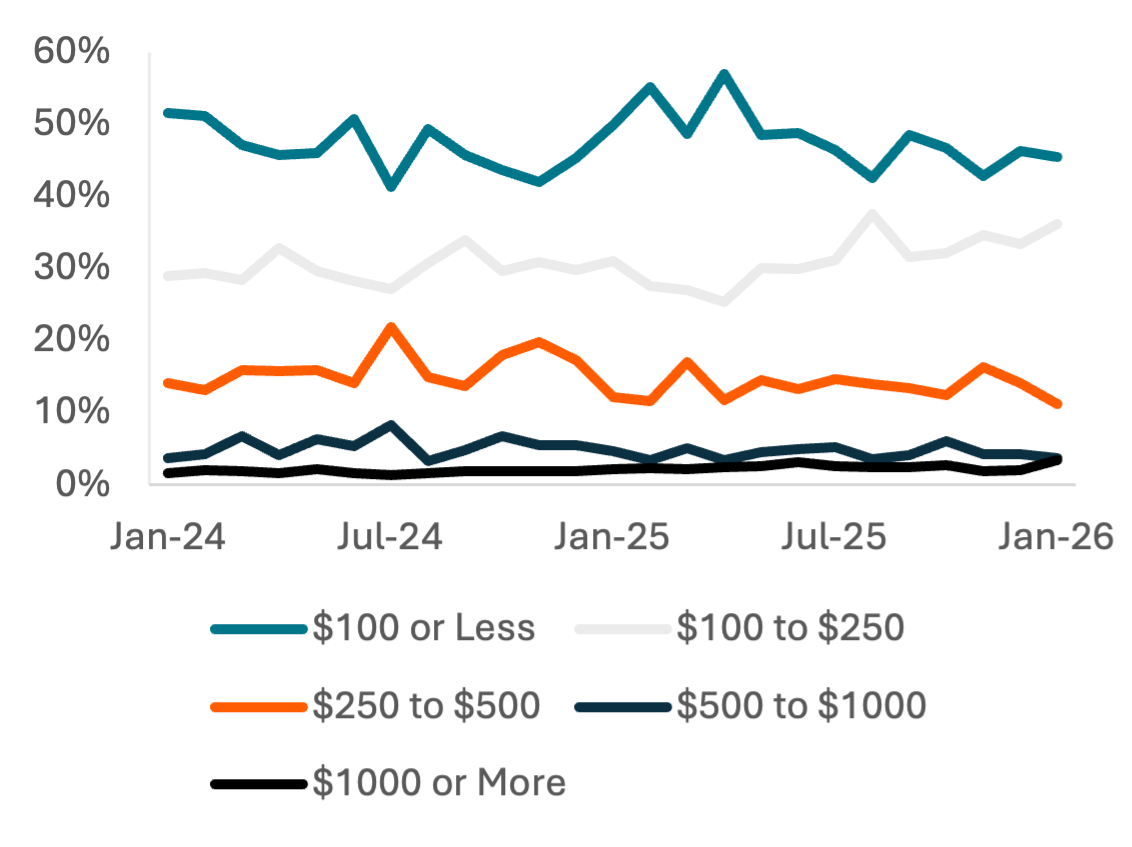
Cookware and electronics show different shifts in the price ranges of consumer purchases, however. Cookware customers are increasing the frequency of purchases in the $250-$500 range, while electronics purchasers are increasing the frequency of purchases less than $250, particularly those between $100 and $250. The opposing trends suggest consumers view their cookware products as more essential and are less willing to compromise on them in the face of shrinking wallets or price increases.
Exhibit 5: Average Item Purchase Price by Category Y/Y Growth
Price: Requires bulk data access, available on request
Exhibit 6: Share of Purchased Cookware Items by Price Range
Price: Requires bulk data access, available on request
Exhibit 7: Share of Purchased Electronics Items by Price Range
Price: Requires bulk data access, available on request
Breville Losing Market Share to Lower-Cost Brands, Even as Competitor Prices Increase
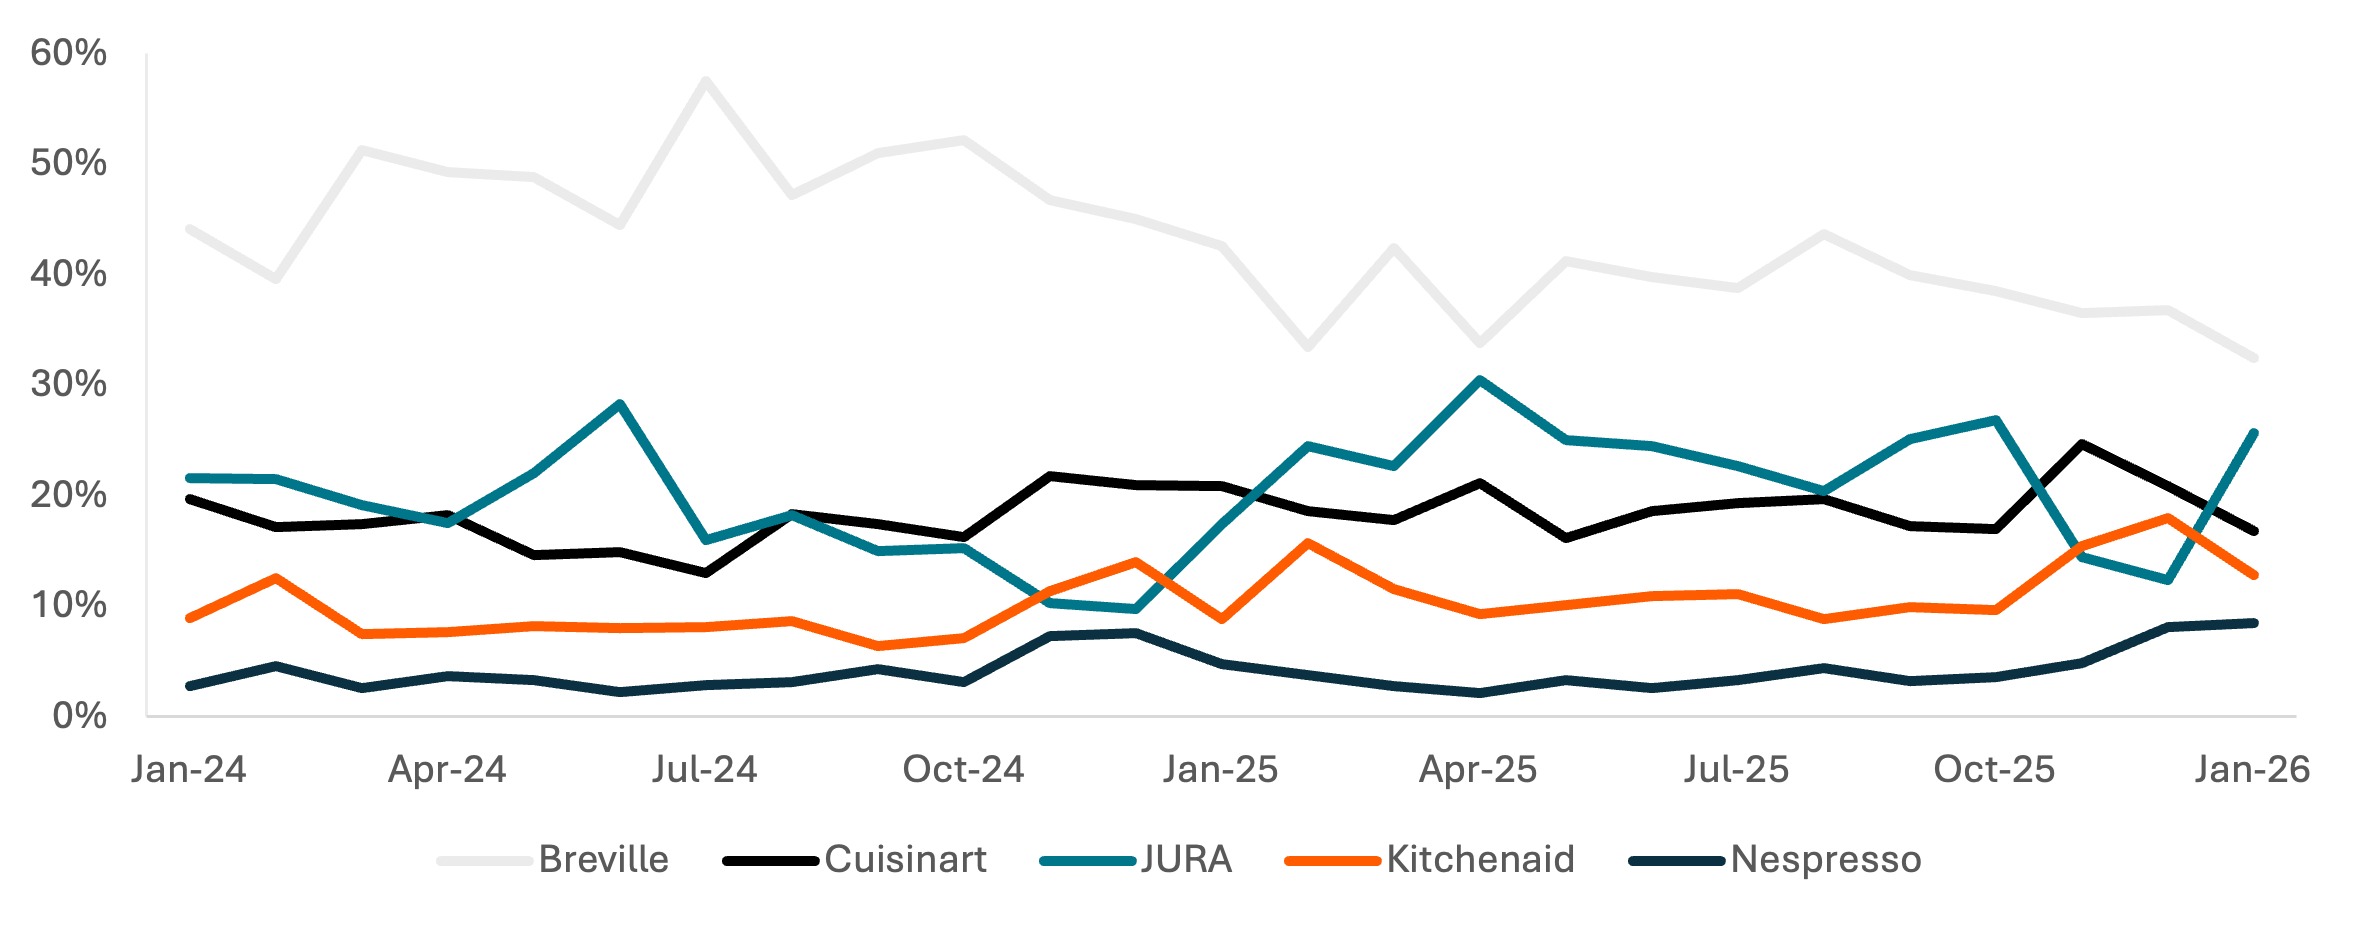
Nearly half of electric or "appliance" products sold in 2024 were made by Breville, but Breville lost market share to Kitchenaid, Cuisinart, and JURA in 2025. JURA and Breville are similarly-priced brands but the surge in popularity for Kitchenaid and Cuisinart indicates a desire to trade-down to more-affordable options. On average, Breville and Cuisinart lost a combined 4.6 pp of market share vs. 2024 in each month of 2025, with larger share losses at the height of "reciprocal tariffs" in the summer and during the holiday season.
However, the items still purchased from Breville appear to be its most expensive, as the average price of purchased items is increasing even as the average price per SKU is decreasing Y/Y. Despite Breville's use of Chinese factories for manufacturing6, JURA, Cuisinart, and Kitchenaid show a clearer impact from tariffs, with average SKU prices increasing up to 38% for JURA, 33% for Cuisinart, and 27% for Kitchenaid. Pricing has eased for JURA, and despite the continued elevation for Kitchenaid products it is still gaining market share.
Exhibit 8: Appliance/"Electronics" Units Sold Market Share
Price: Requires bulk data access, available on request
Exhibit 9: Average Purchased Item Price
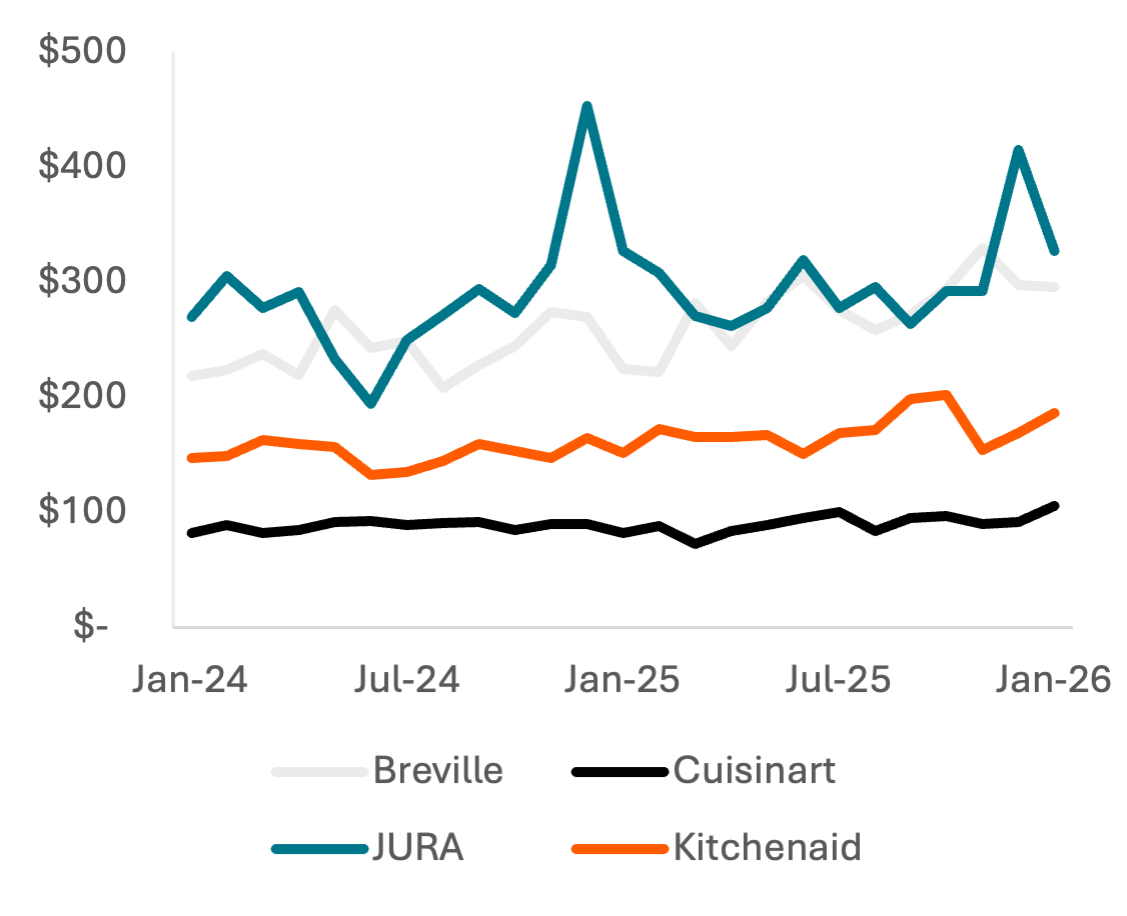
Price: 61.16 Tokens
Exhibit 10: Average SKU Price Y/Y Growth
Price: Requires bulk data access, available on request
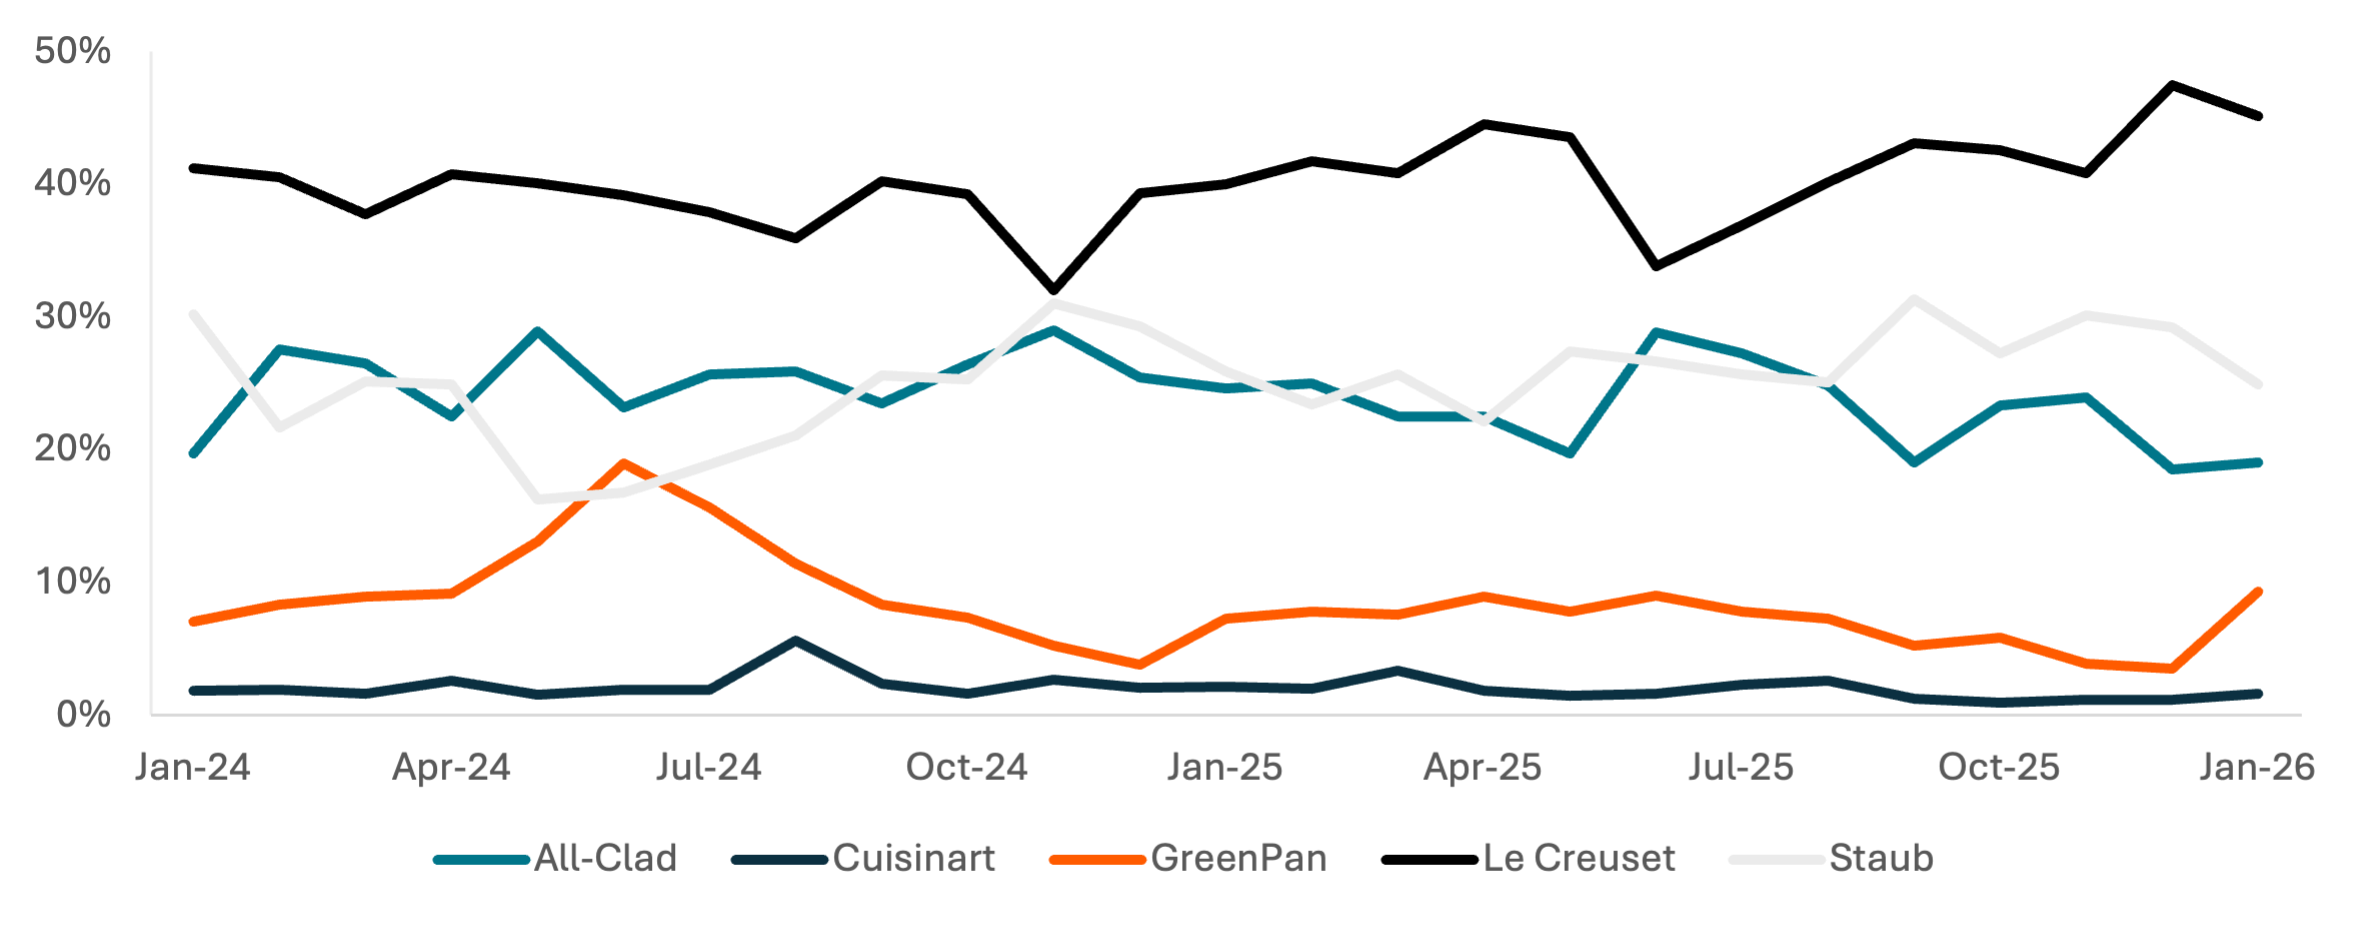
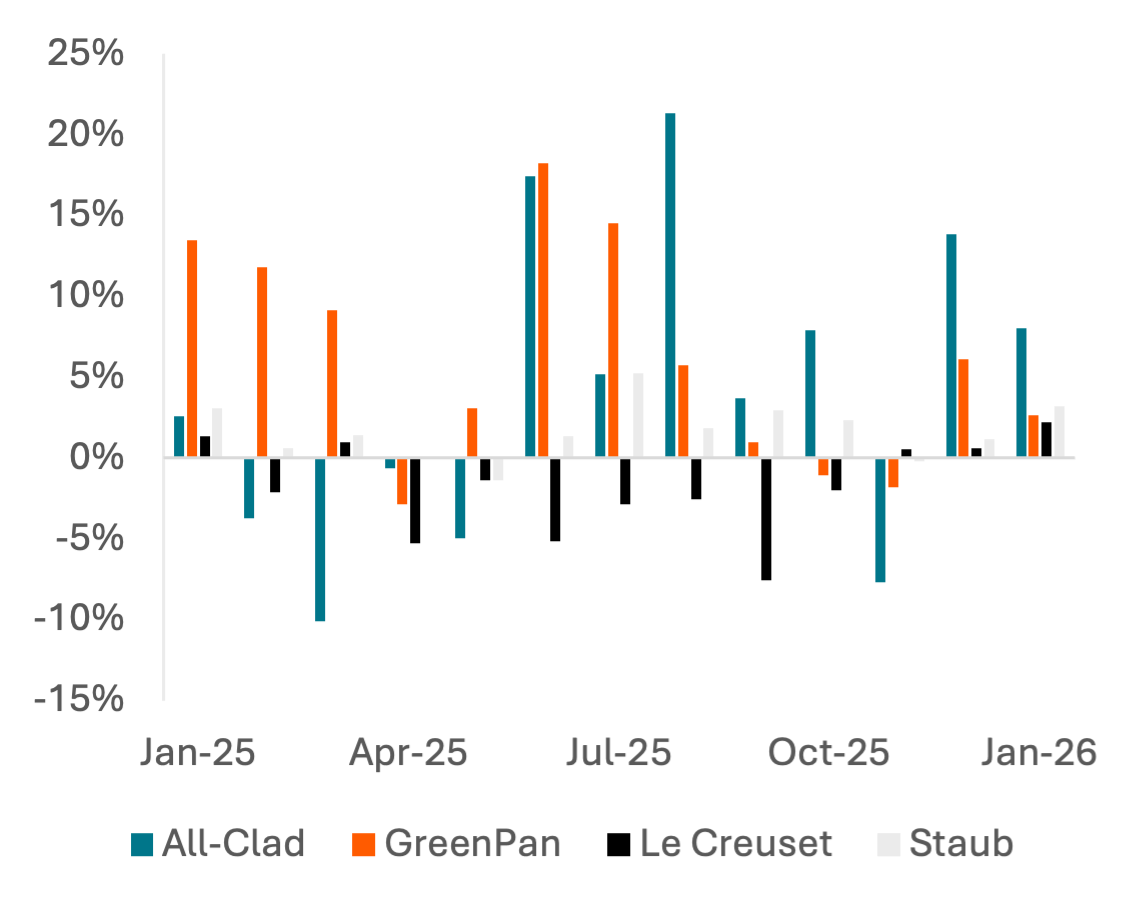
All-Clad and GreenPan Show Tariff Impact on Consumer Decision-Making
Market share of cookware brands is more stable, as the largest brands in the segment have similar pricing once in the consumer's cart; All-Clad SKU prices average to be more expensive than Le Creuset due to large, expensive cookware sets that are purchased less frequently than a singular pot or pan. All-Clad's share of units sold declined in 2025 as both average SKU prices and average purchase prices increased more-rapidly than the cast iron and Dutch ovens of Le Creuset and Staub; tariffs on France and Thailand, where Le Creuset and Staub manufacture products, are lower than tariffs on China.
All-Clad products are made in the U.S., with its sourcing of steel not publicized, but steel prices rose in 2025 due to tariffs of at least 50% on steel imported from China4. Similar pricing trends for GreenPan, which does manufacture its products in China, suggests impact from Chinese tariffs for All-Clad.
Market share improvement for Le Creuset and Staub, while slight, suggests consumers in cookware are responding to price increases by making substitutions, even if product functionality is not fully equivalent.
Exhibit 11: Cookware Units Sold Market Share
Price: Requires bulk data access, available on request
Exhibit 12: Average Purchased Item Price
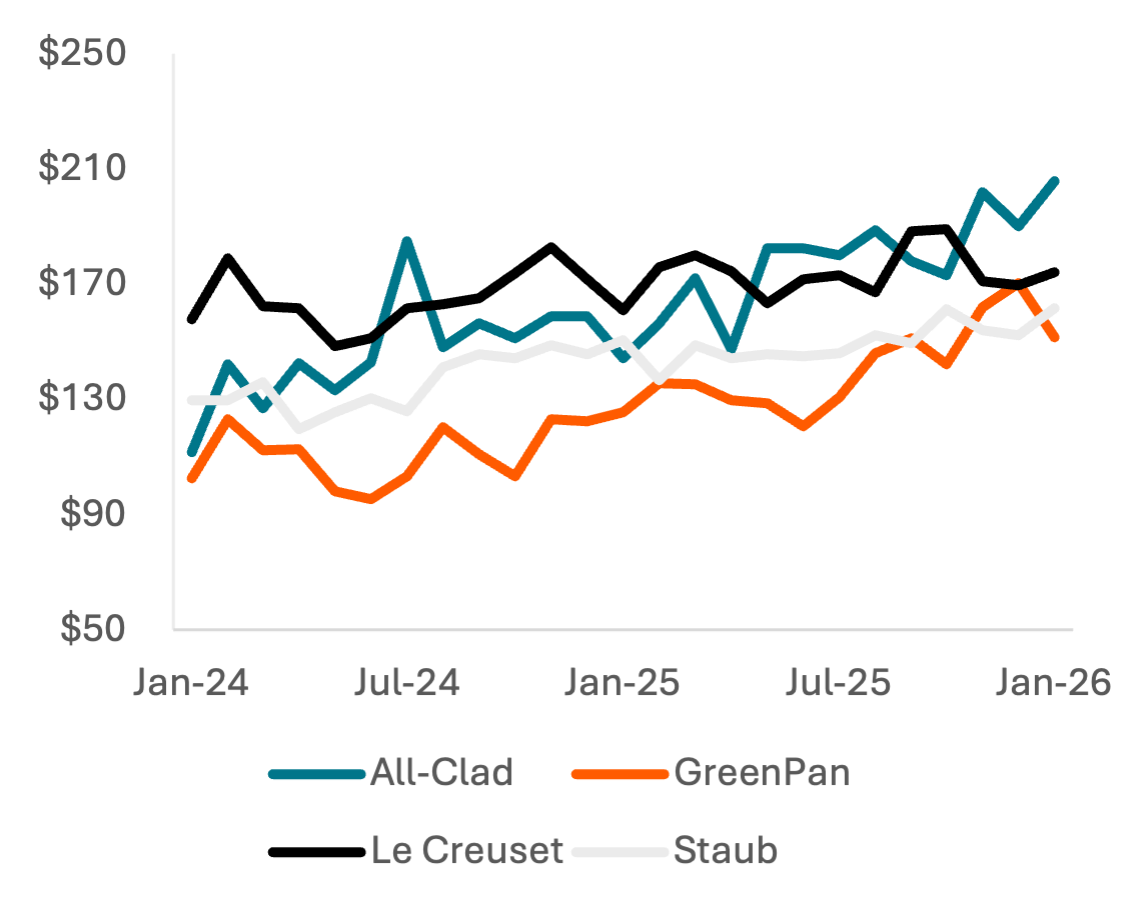
Price: 61.16 Tokens
Exhibit 13: Average SKU Price Y/Y Growth
Price: Requires bulk data access, available on request
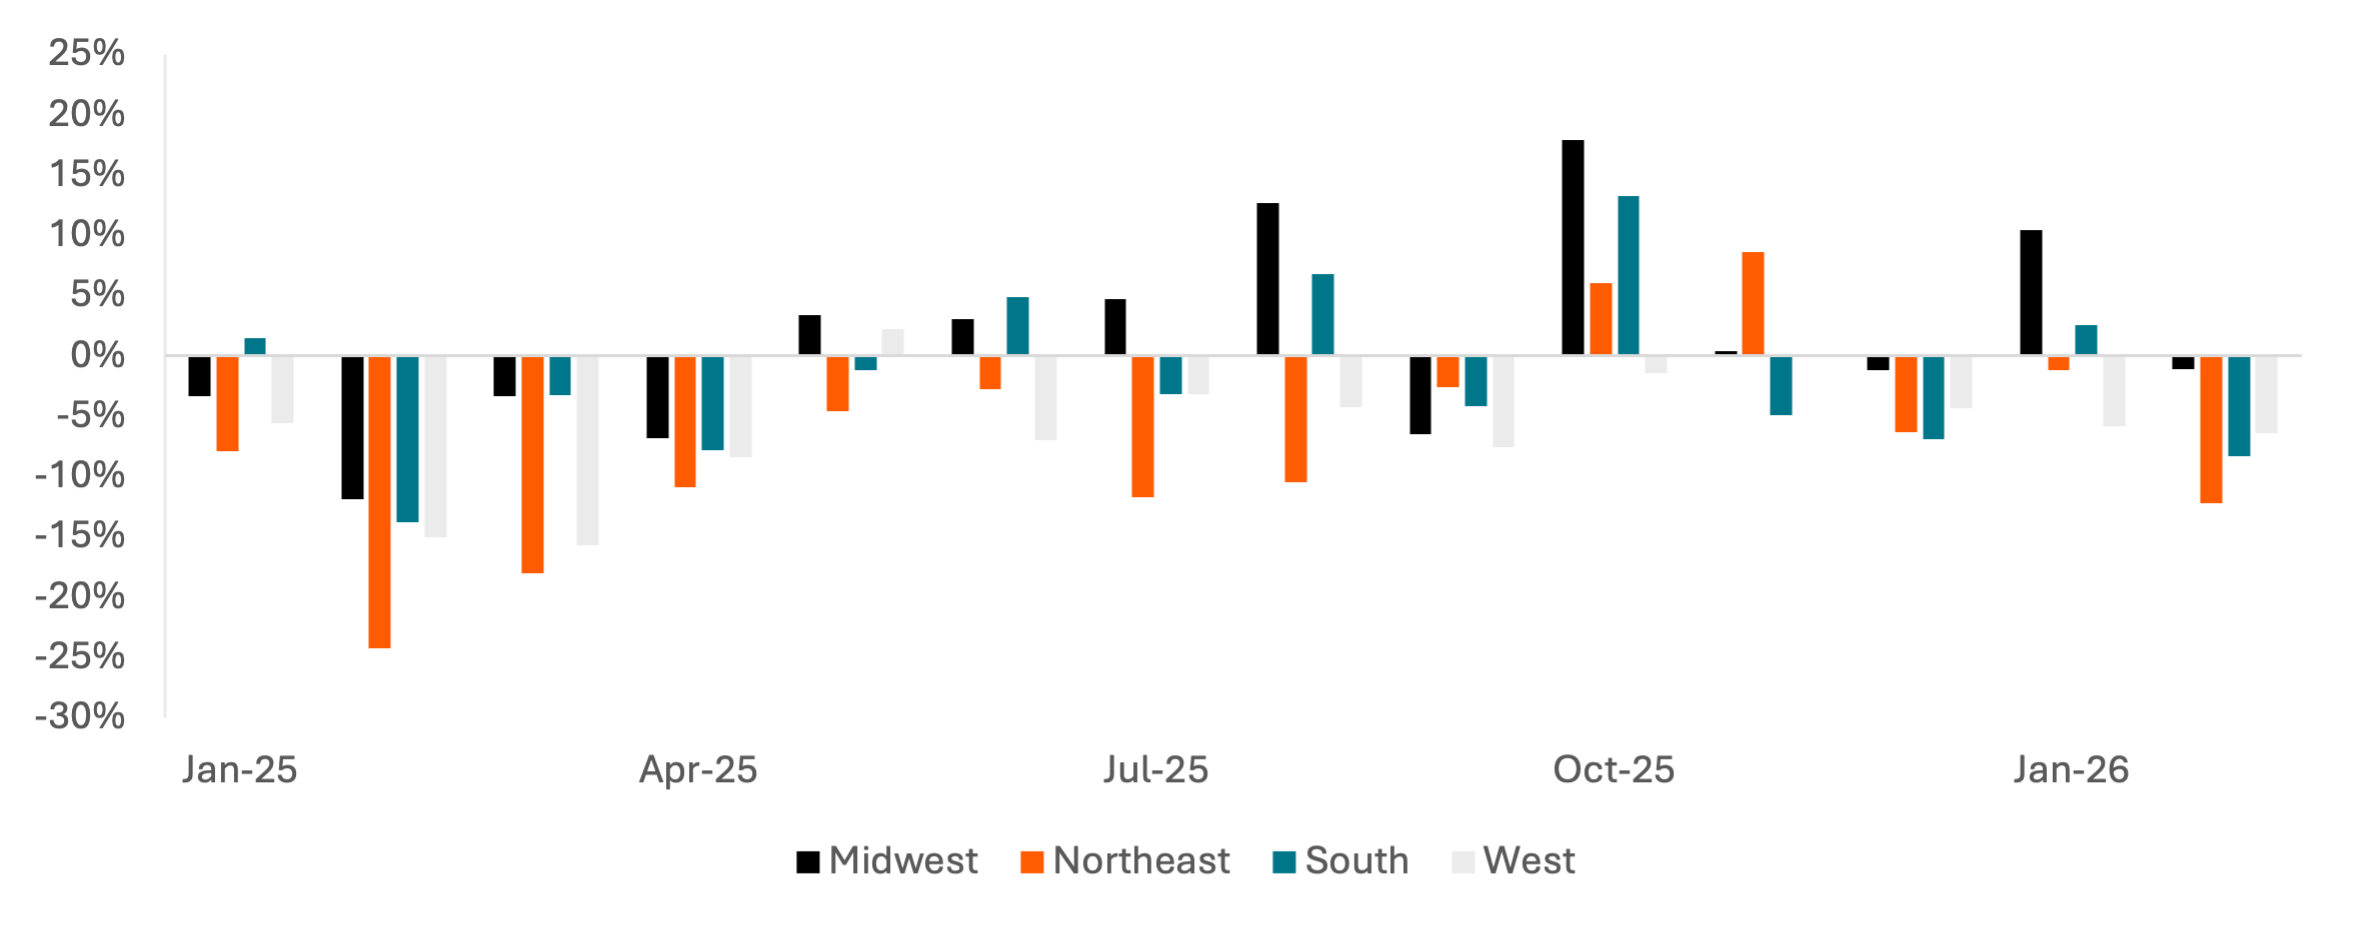
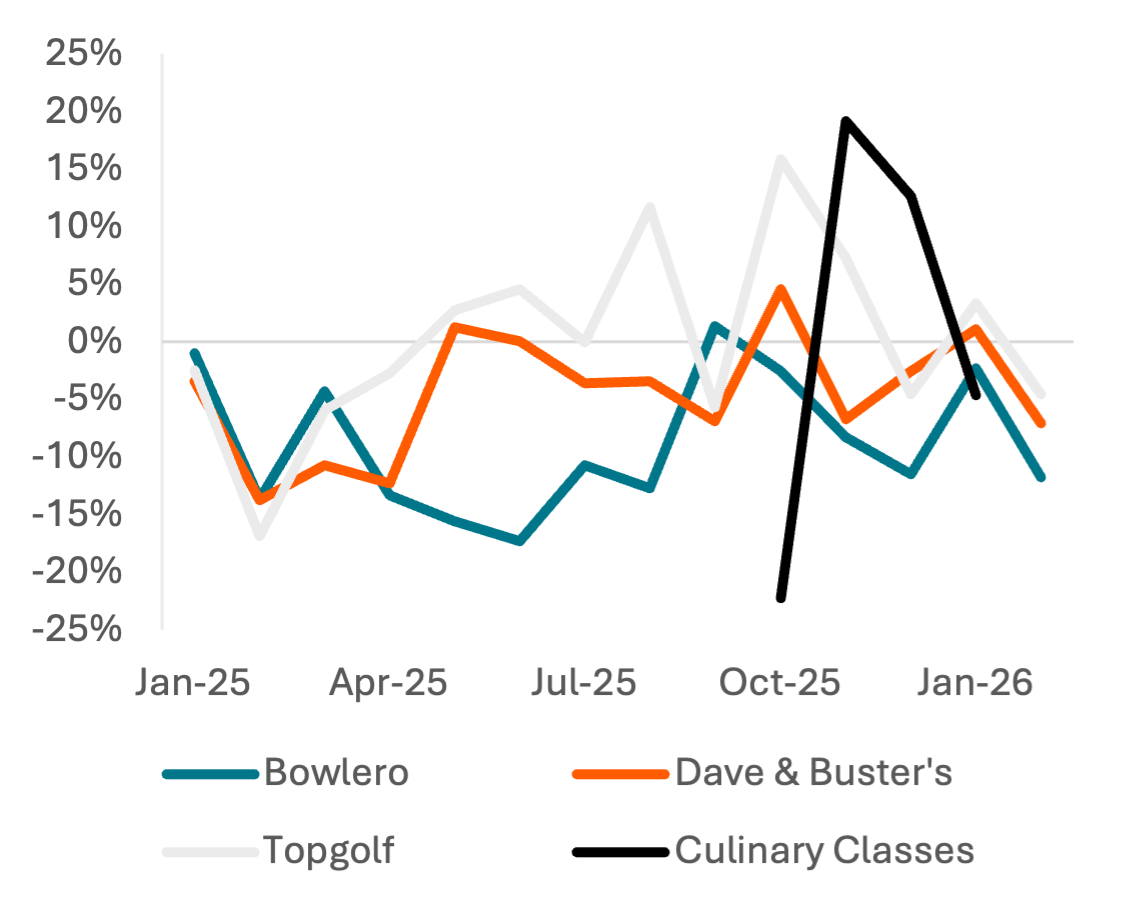
Cooking Classes and Downward Trends in Leisure Consumption
Carbon Arc's POS – Premium Culinary Retail dataset also provides insight into cooking classes, expanding insight into the leisure spend of consumers. Leisure spend fell across the U.S. during February, perhaps partially driven by major snowstorms, but spend in the Northeast has been weaker than any other region since January 2025. February, and to a lesser extent December, saw the weakest consumer spending on leisure since 1H25. That negative momentum is reflected in cooking class data, with spend on cooking classes growing significantly year-over-year in November and December before falling in January.
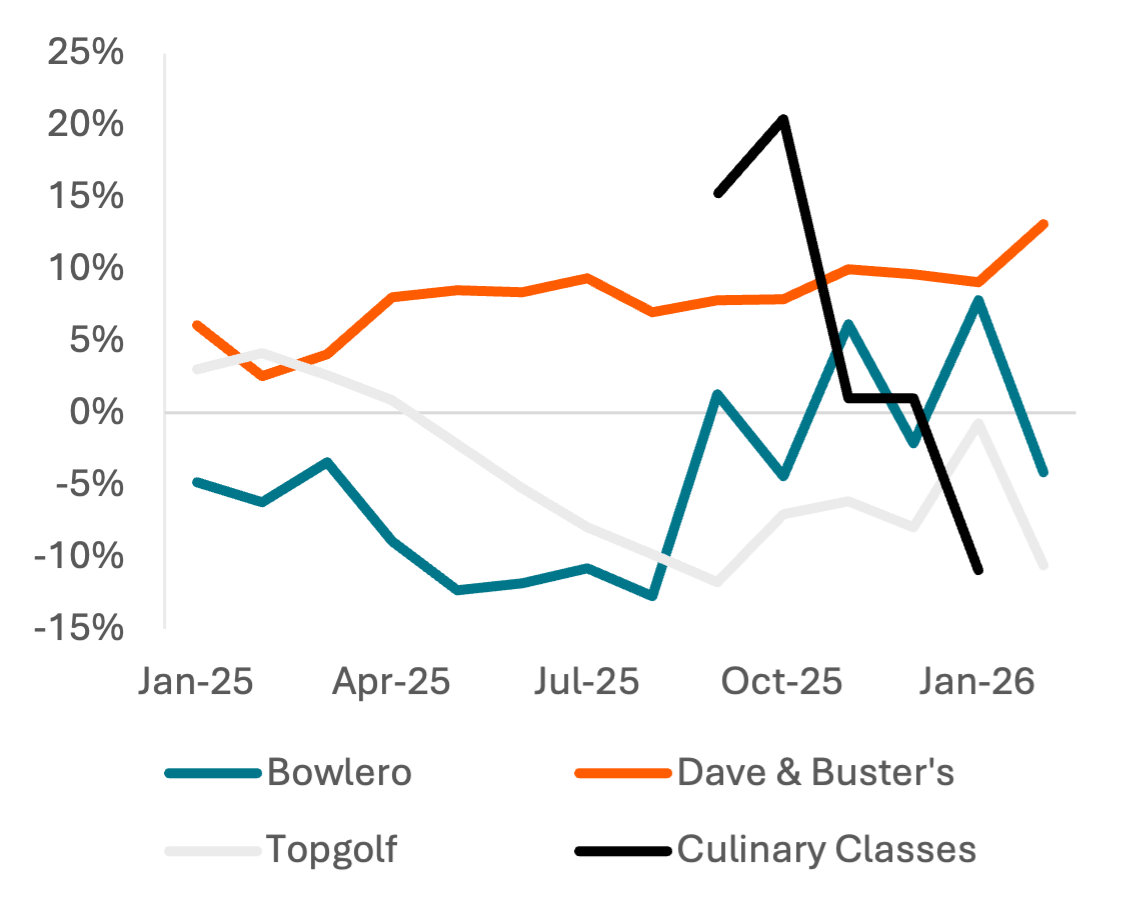
Recent spend growth is negative despite improvements in transaction values for Bowlero and Dave & Buster's, suggesting more-pressured consumers are staying away altogether even as better-off customers spend freely. Spend growth on culinary classes appears heavily driven by ticket, which fell alongside spend in January.
Exhibit 14: Bowlero, Dave & Buster's, and Topgolf Combined Credit Card Spend Y/Y Growth
Price: 10.63 Tokens
Exhibit 15: Spend Y/Y Growth
Price: Requires bulk data access, available on request
Exhibit 16: Average Transaction Value Y/Y Growth
Price: Requires bulk data access, available on request
References
-
The Wall Street Journal. "The Year of America's Cranky Consumer." The Wall Street Journal, December 7, 2025. https://www.wsj.com/economy/consumers/the-year-of-americas-cranky-consumer-39ba0b2d
-
The Wall Street Journal. "Sizing Up the U.S. Economy in Trump's First Year." The Wall Street Journal, February 24, 2026. https://www.wsj.com/economy/sizing-up-the-u-s-economy-in-trumps-first-year-07a68adf
-
The Wall Street Journal. "How the K-Shaped Economy Plays Out in Grocery Aisles." The Wall Street Journal, February 26, 2026. https://www.wsj.com/finance/stocks/how-the-k-shaped-economy-plays-out-in-grocery-aisles-dc29121c
-
Trading Economics. "HRC Steel Price - Chart - Historical Data - News." Trading Economics, accessed March 8, 2026. https://tradingeconomics.com/commodity/hrc-steel
-
GreenPan. "About GreenPan." GreenPan, accessed March 8, 2026. https://greenpan-housewares.com/en-int/about-greenpan
-
Australian Financial Review. "Breville Uncouples Booming American Sales from Chinese Manufacturing." Australian Financial Review, November 6, 2025. https://www.afr.com/companies/retail/breville-sales-trending-upward-buoyed-by-high-end-consumer-spend-20251106-p5n865
Questions?
Contact us at support@carbonarc.co if you have any questions!
CARARC-20260310-COOKING-0001