Economic Spotlight
Carbon Arc Data Assets: SMB Workforce, Credit Card – US Complete Panel, Foot Traffic, Vehicle Registrations, POS – Convenience Stores
January 22, 2026
Executive Summary
At the national level, the small and medium-sized business (SMB) workforce contracted by an estimated -0.57% in 2025, its first annual decline post-COVID. While growth slowed broadly, workforce contraction was not uniform across regions, sectors, or congressional districts, where local policy and demographic dynamics play a meaningful role. In this report, we use Carbon Arc’s SMB Workforce data, along with complementary data assets, to rank congressional districts1 by their workforce changes in 2025, examine representation across expanding and contracting districts, and explore links between local SMB workforce trends and consumer activity.
Key Takeaways
-
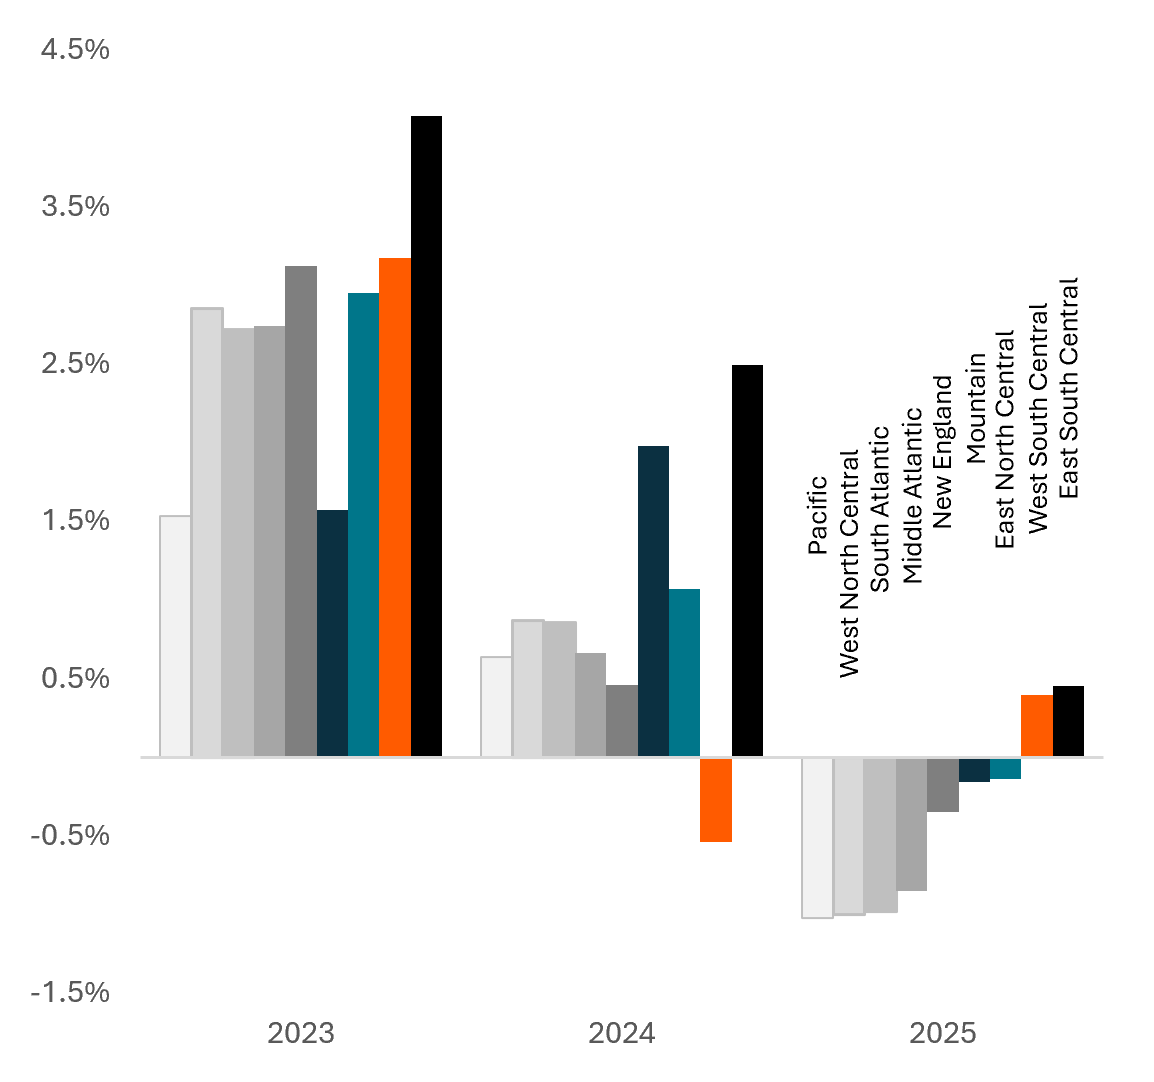
While the overall SMB workforce declined at the national level in 2025, central regions exhibited more supportive environments than those on either coast, led by the East and West South Central census divisions.
-
At the sector level, workforce expansion continued in 2025 within the Utilities, Finance & Insurance, and Other Services2 sectors, while Accommodation & Food Services and Information sectors experienced the largest contractions.
-
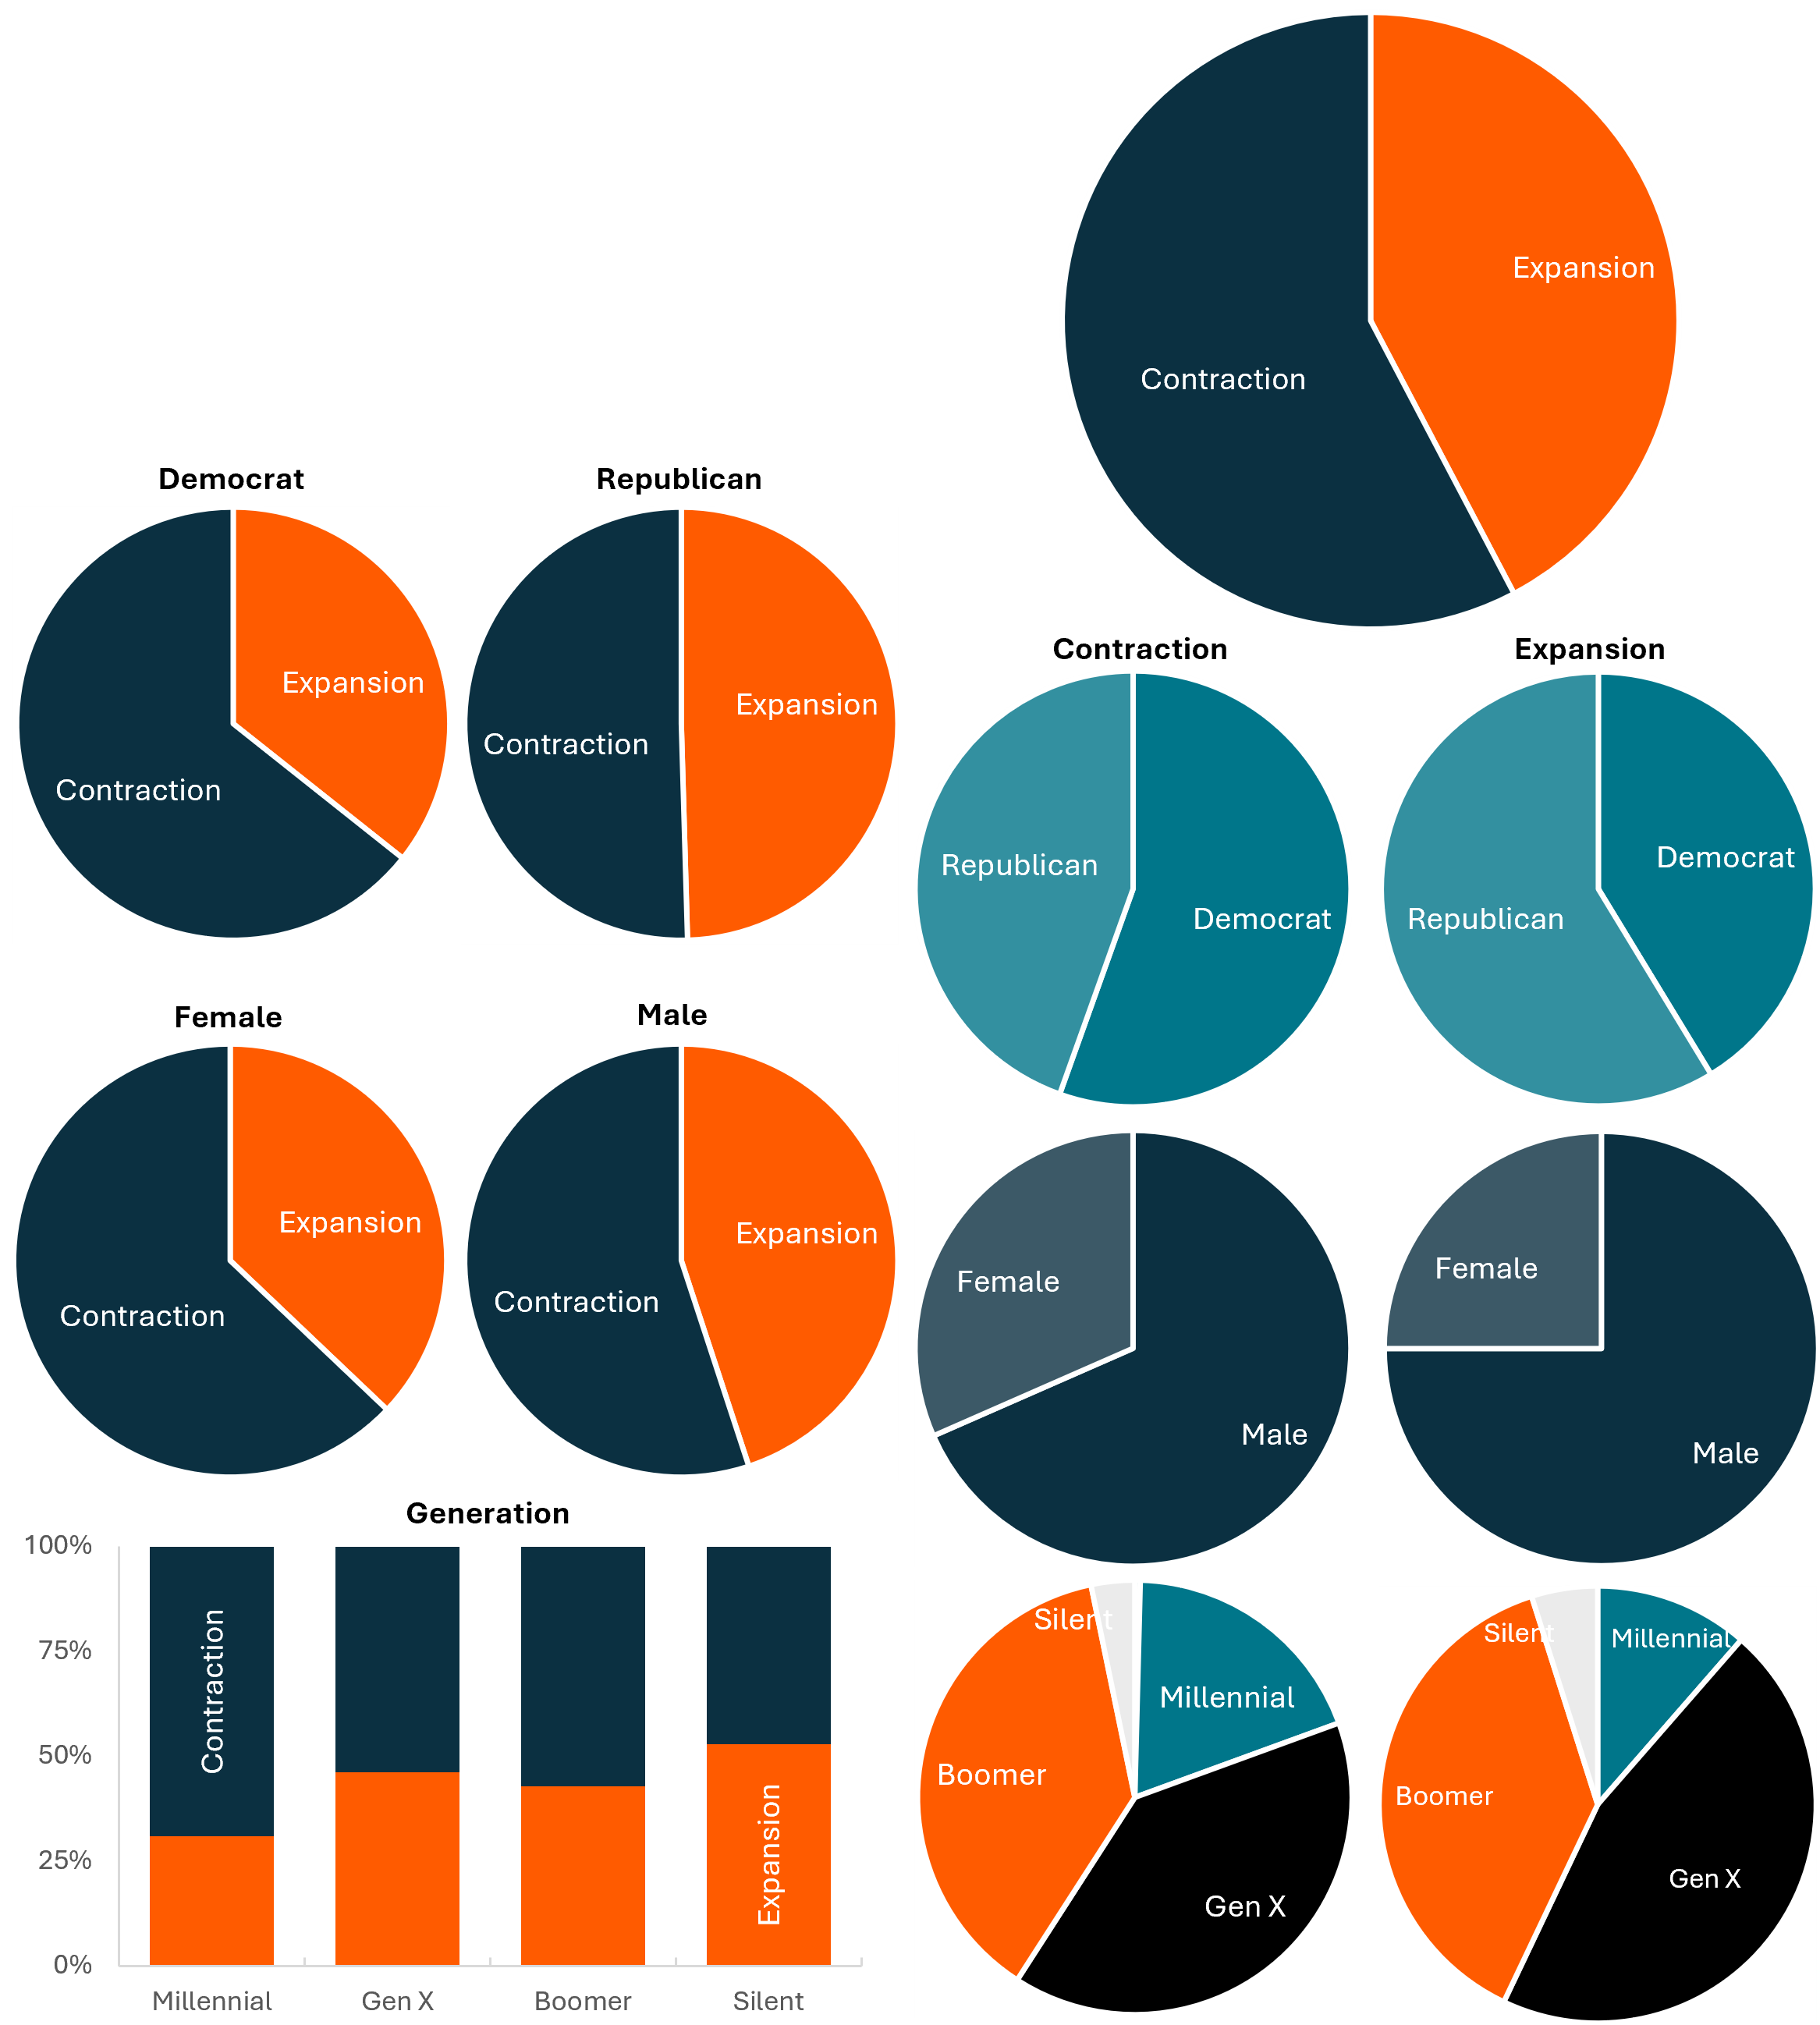
58% of congressional districts1 experienced contracting SMB workforces in 2025. While there were themes in the demographics of representation across districts (see page 4), no single demographic had a majority of districts with expanding SMB workforces in 2025.
-
Texas had the most congressional districts with outsized SMB workforce growth in 2025, while New York had the most districts with outsized workforce reductions.
-
Among the congressional districts with the largest SMB workforces, New Jersey’s 6th district (NJ-06) had the largest workforce expansion in 2025. The district has experienced outsized SMB growth in recent years, which came with sharp increases in the proportion of new vehicle registrations, a measure of relative economic strength.
-
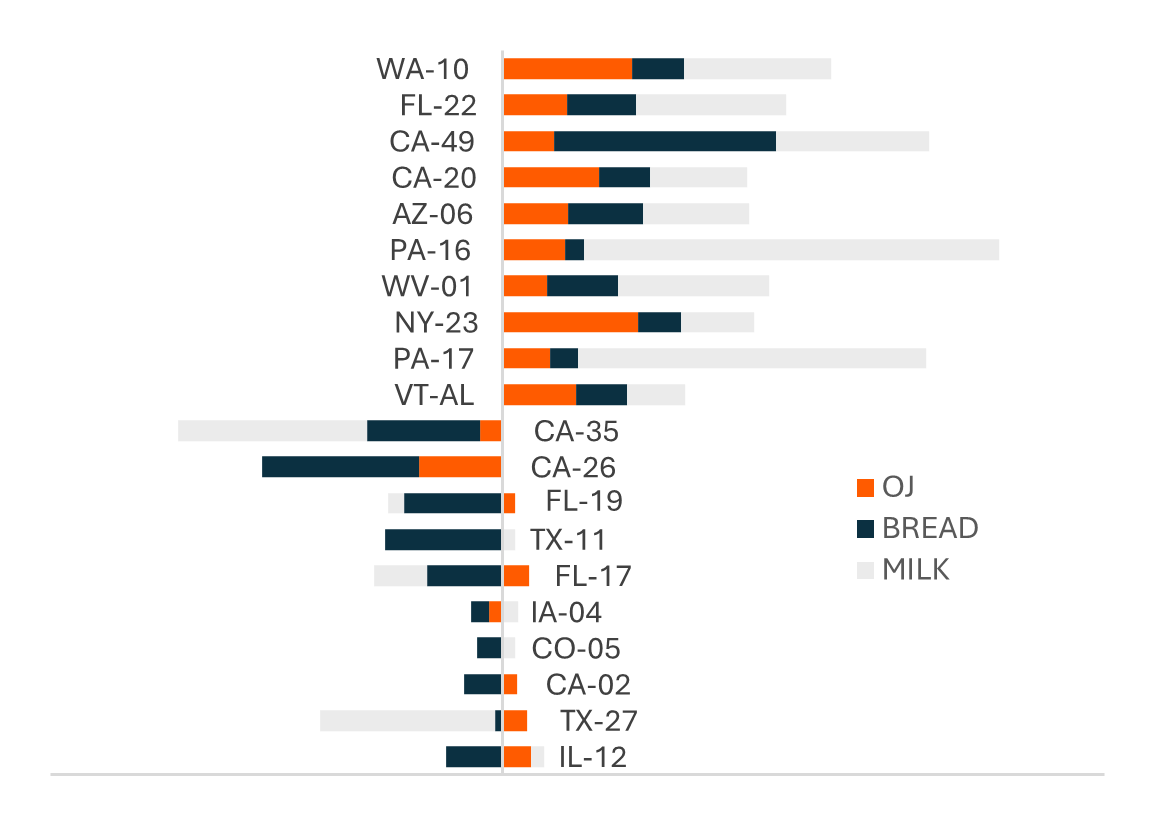
Inflation of consumer staples across congressional districts was often uncorrelated to SMB workforce growth. Washington’s 10th district and Florida’s 22nd both experienced relatively broad price increases in milk, bread and orange juice while experiencing SMB workforce contraction in 2025.
SMB Workforce Themes in 2025
SMB workforce growth had been decelerating for several years before turning negative in June 2025. What’s clear is that the post-COVID period of rapid expansion is long over and those within the SMB workforce are facing a period of economic uncertainty. At the regional level, we see that over recent years slowing growth is universal, but workforce contraction in 2025 was not, and there are even parts of the country where the SMB workforces continued to expand each year (East South Central). At the sector level, often a driver of regional differences, we see that while a handful of sectors’ SMB workforce expanded, the vast majority contracted in 2025.
Congressional districts differ meaningfully in their industrial mix, workforce composition, and exposure to local policy decisions. Understanding how jobs are growing or contracting at the district level provides a clearer picture of where economic momentum may be building, where it is fading, and why. With economic growth often driving political change -- and midterm elections approaching – we’ve ranked congressional districts by SMB workforce growth or contraction in 2025.
Exhibit 1: Monthly indexed SMB workforce (bars, left) and Y/Y change (line, right), December data in orange
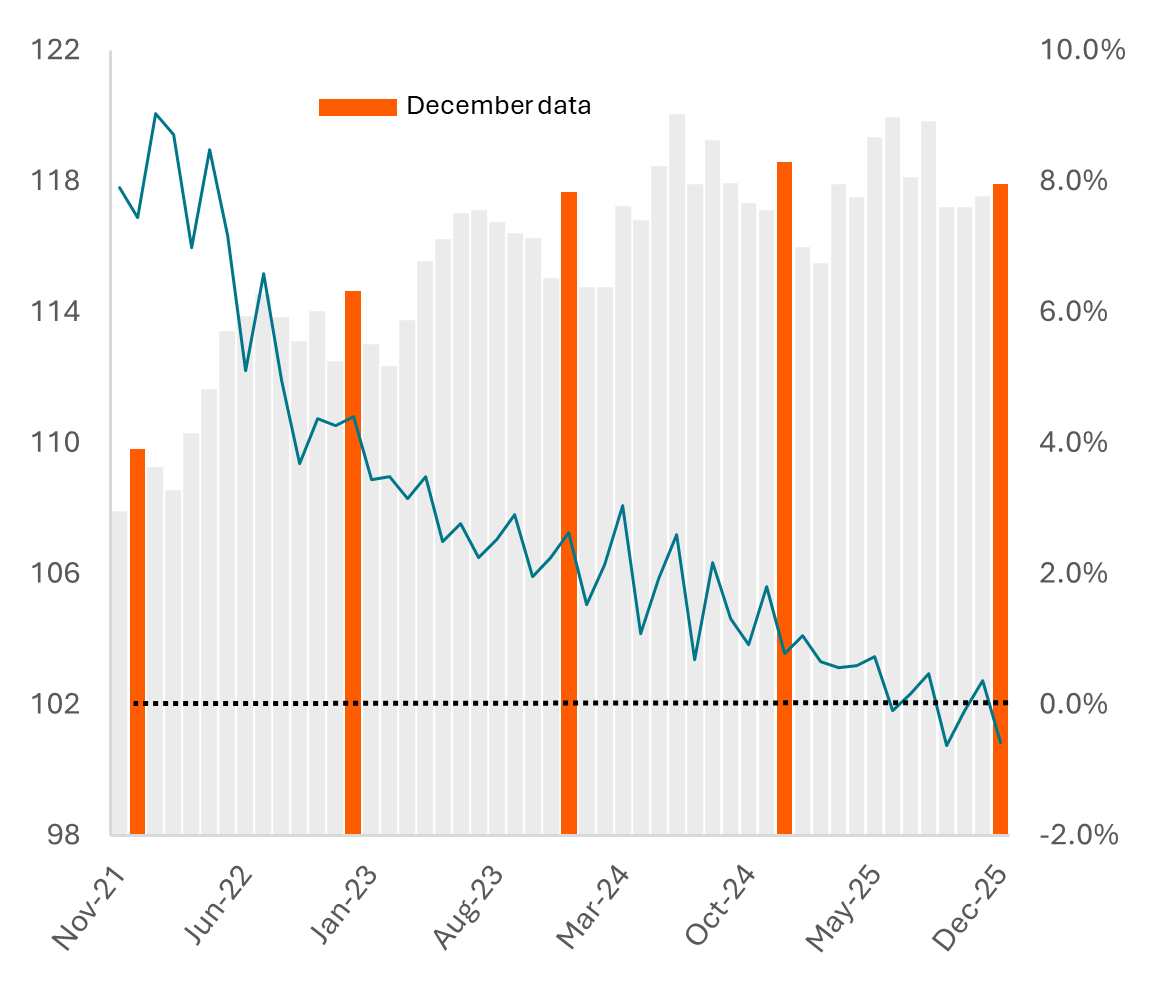
Exhibit 2: Change in SMB workforce by NAICS-2 sectors in 2025
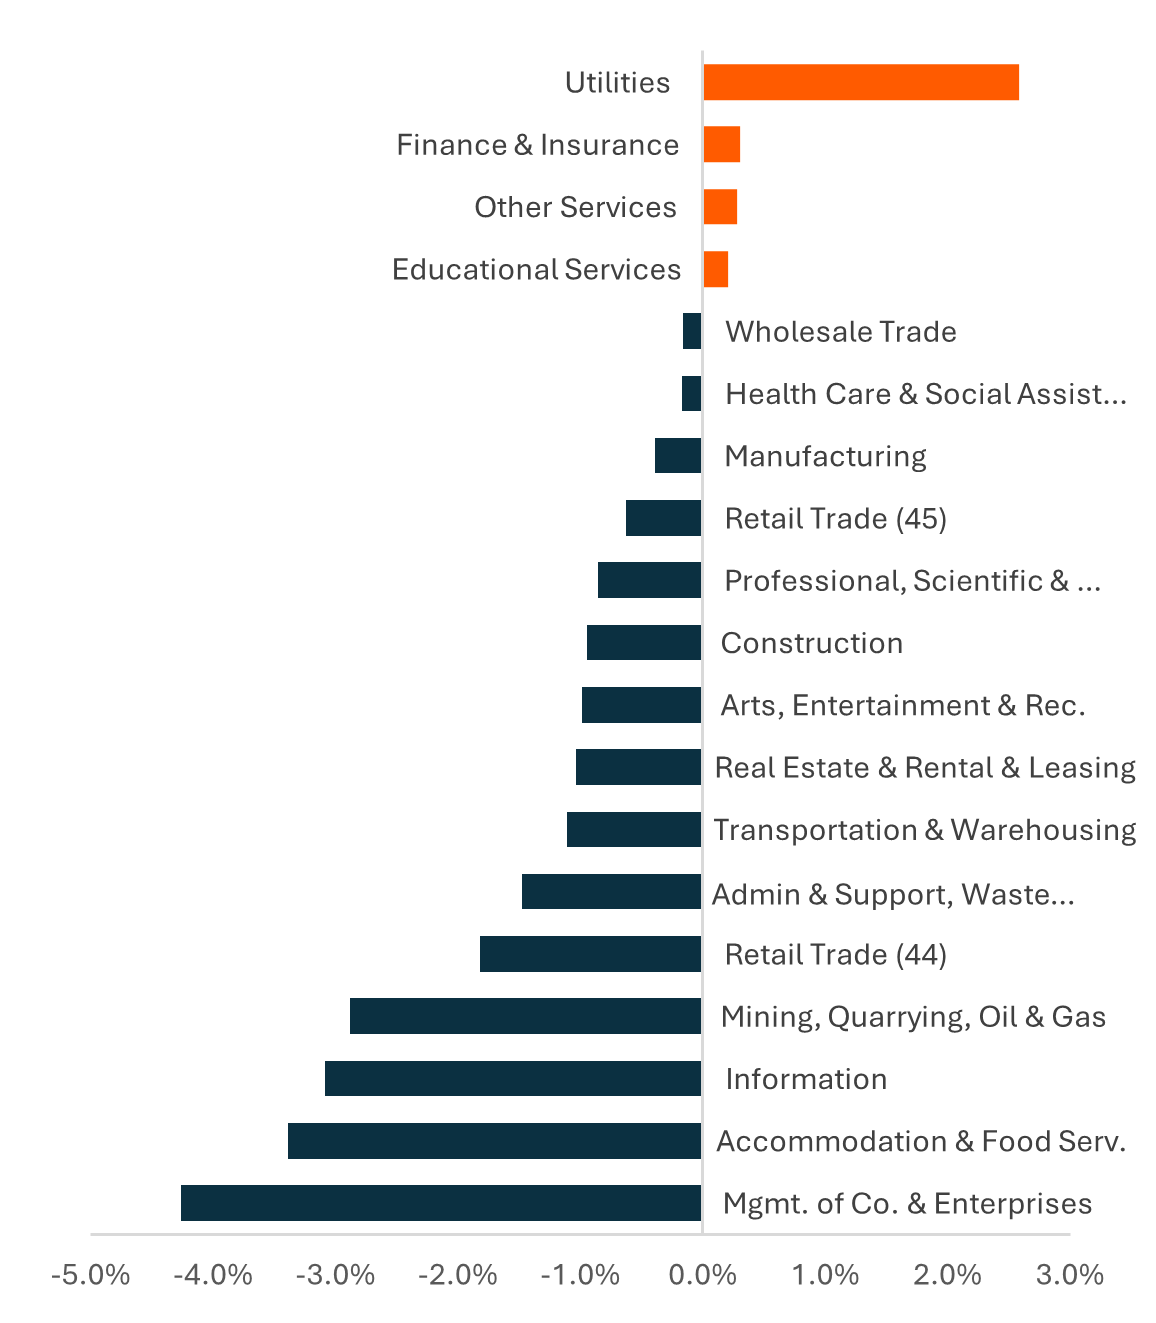
Exhibit 3: Annual change in SMB workforce by census divisions
Price: requires row-level block data access, available on request
Composition of Representation Across Congressional Districts’ SMB Workforces
The following charts break down the demographics of U.S. representatives of congressional districts by expanding or contracting SMB workforces in 2025. Demographics include political affiliation, sex, and age, and the breakdown is by count of districts. While there were tendencies across districts, no single demographic had a majority of districts with expanding SMB workforces in 2025. These results are for informational purposes only and are not a statement of effectiveness or causation.
Exhibit 4: Distribution of congressional districts by SMB workforce expansion vs. contraction in 2025
Price: requires row-level block data access, available on request
Congressional District Change with a Regional and National Perspective
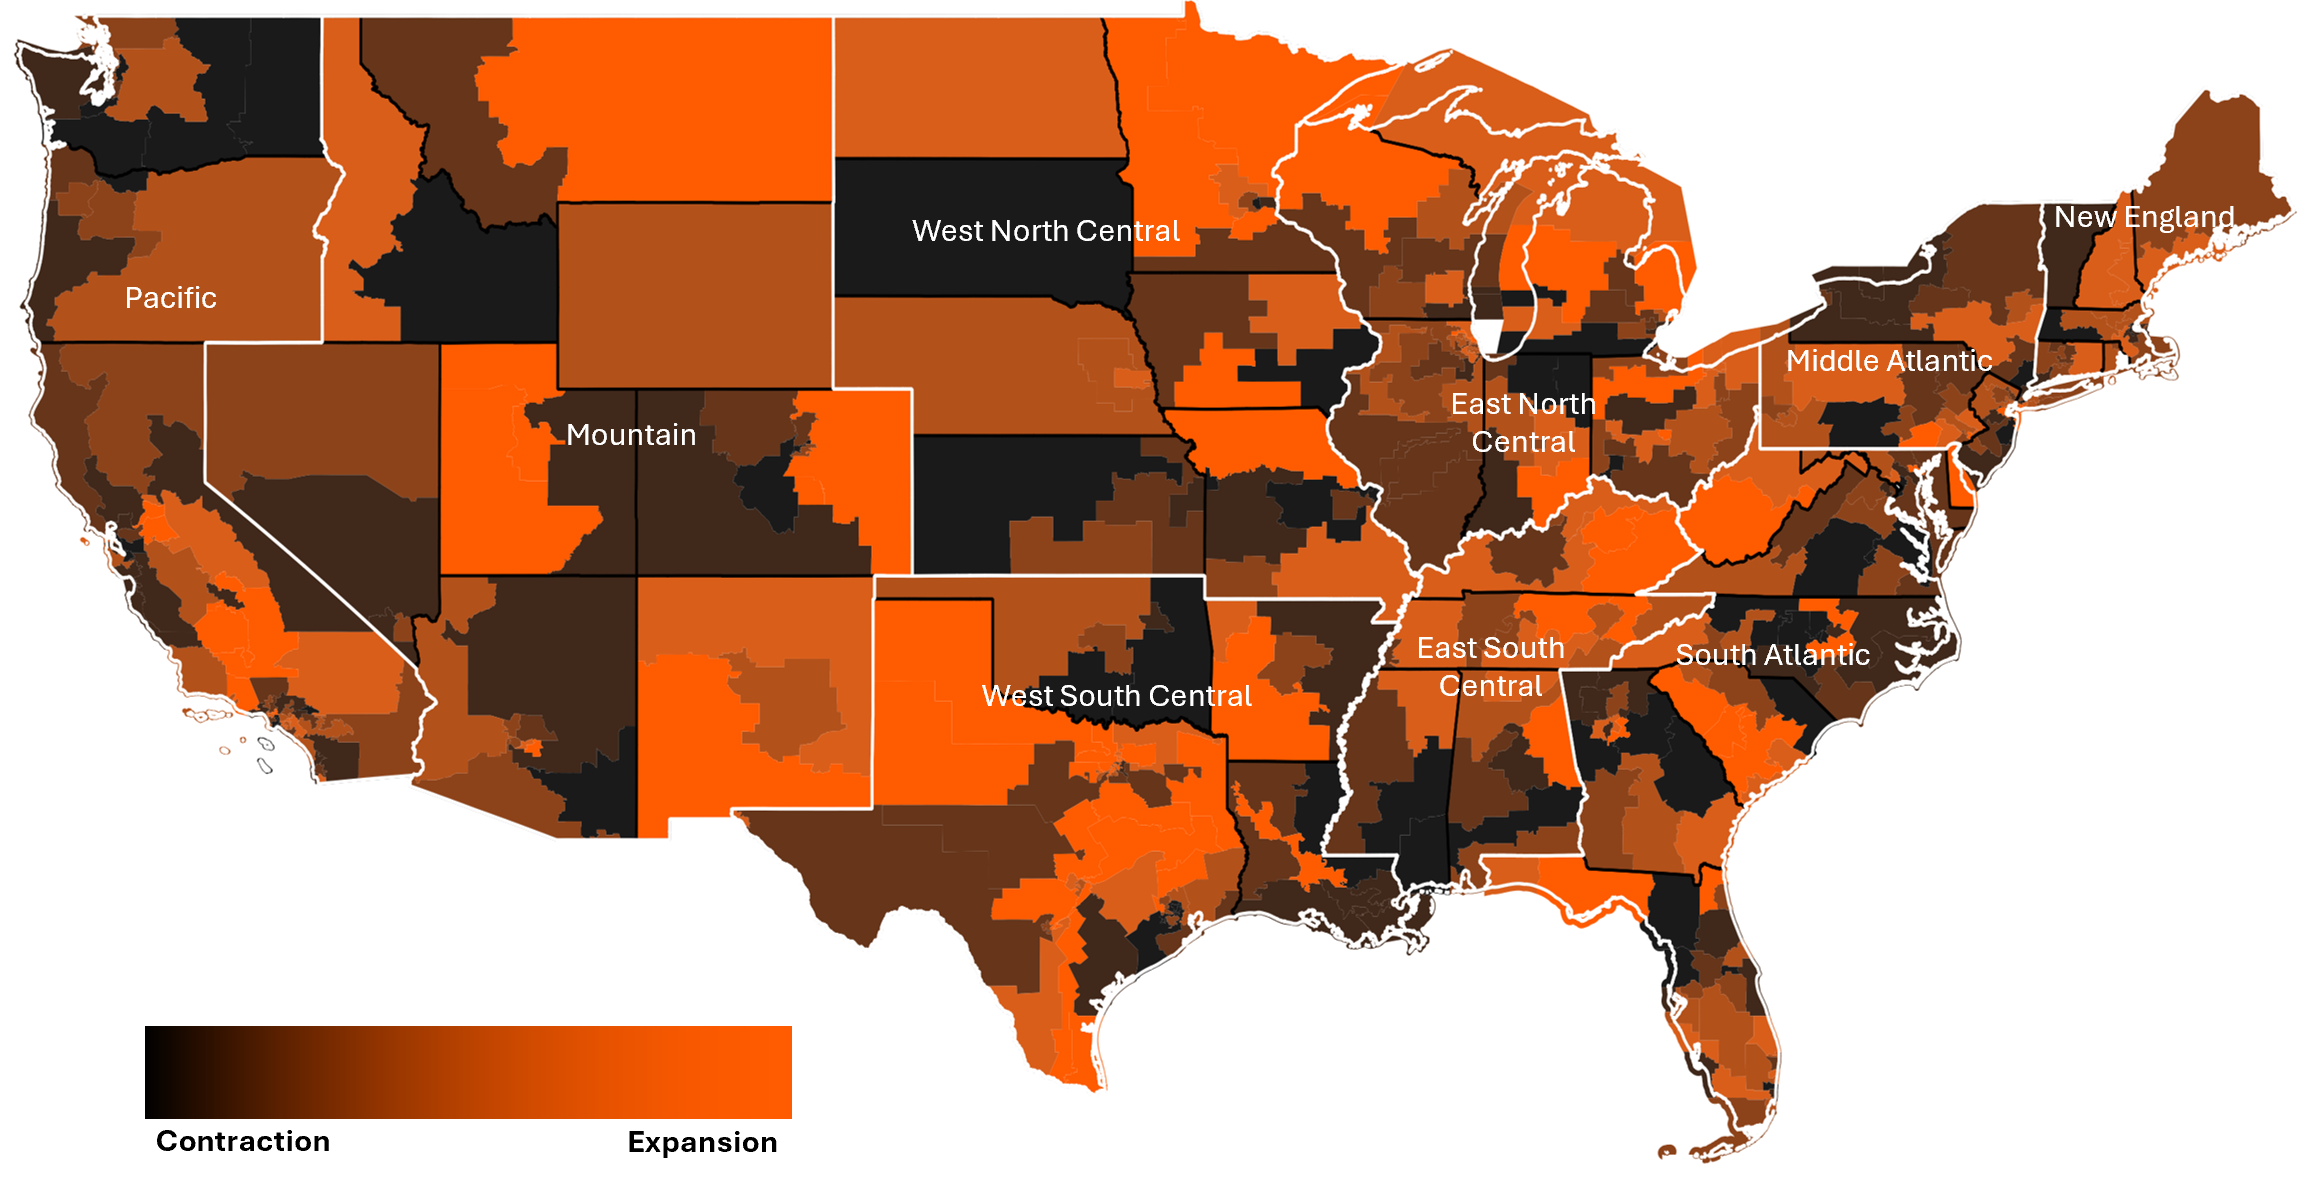
The map below, along with the census division growth rates for 2025 (right), illustrates the diverse distribution of SMB workforce expansion and contraction in 2025 at the congressional district level. For example, within the Pacific region, where the SMB workforce not only declined the most in 2025 but has lagged all other divisions over the last three years, there are pockets of SMB workforce growth large enough to rank the districts among the ten largest for worker-count-weighted growth in 2025.
Similarly, within the East South Central division, where SMB workforce growth has led all others over the last three years, and SMB expansion has been concentrated in its northern region, there are pockets of elevated growth in smaller southern districts, like Alabama’s 3rd. An exception is in New England where, while there are pockets of expansion and contraction, there are no districts where workforce growth was relatively strong. There are, however, districts where the SMB workforces are contracting relatively fast, like Massachusetts’s 7th.
Exhibit 5: SMB workforce change in 2025 by census division

Price: requires row-level block data access, available on request
Exhibit 6: Choropleth of congressional districts color-coded by rates of SMB workforce expansion or contraction in 2025 with census division segmentation in white
Price: requires row-level block data access, available on request
Ranking of SMB Workforce Change by US Congressional Districts
On this page we provide the rankings of US congressional districts’ SMB workforce growth for two categories, the largest districts by worker counts (Exhibit 7), and the districts with the highest overall rates of expansion and contraction, indexed by relative workforce size (Exhibits 8-9).
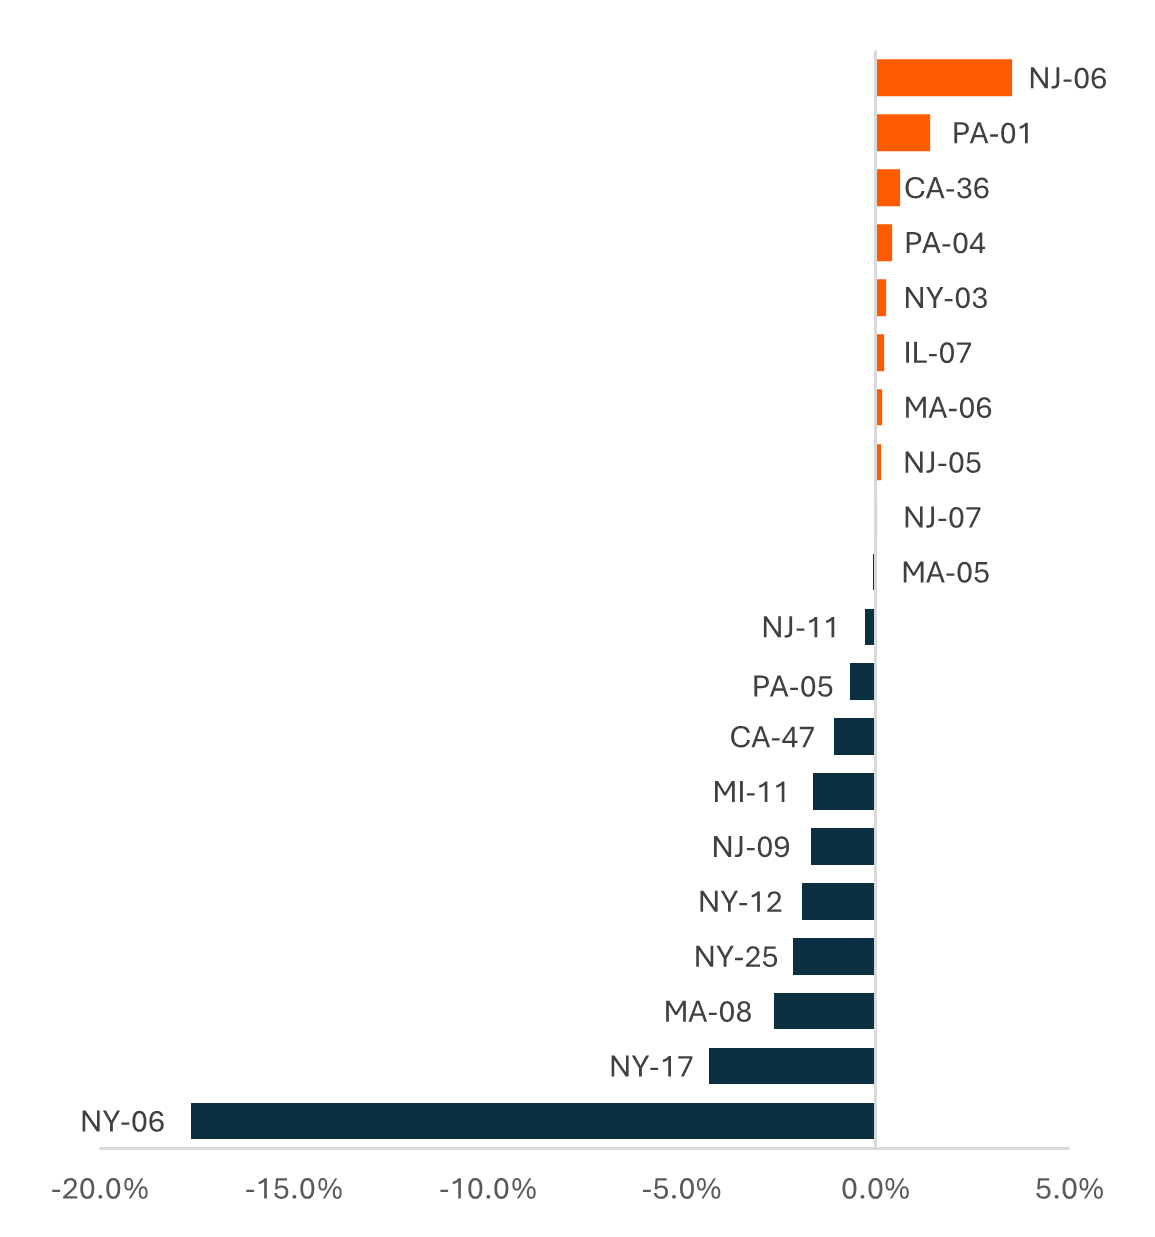
Exhibit 7 ranks the 20 congressional districts with the largest SMB workforces by their growth rates in 2025. Two points jump out, the majority of large districts contracted in 2025, and the rates of contraction were far greater than expansion.
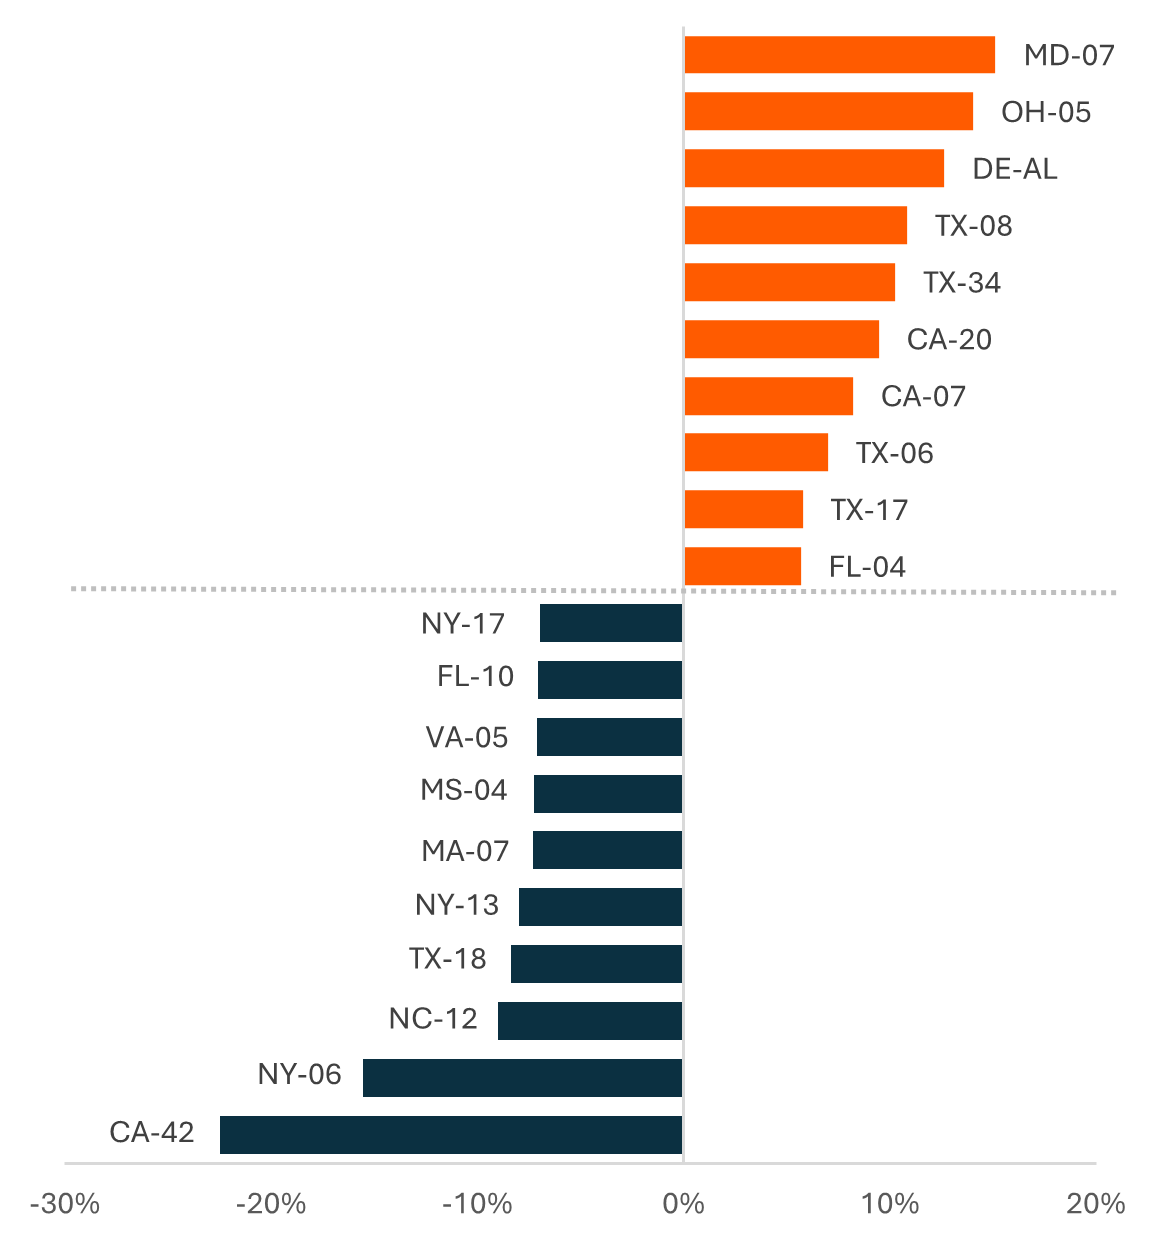
Exhibits 8-9 show the districts with the highest rates of SMB workforce expansion or contraction by overall growth rates in 2025 indexed to worker counts, and their relative worker count gains and losses during the year. The index weighting is to highlight districts with significant rates of SMB workforce change not driven simply by the size of their workforces. Two points again jump out, Texas has the most districts among the top 10, and building on Exhibit 1, New York is a leader for SMB job losses, and it is not just about the size of the state’s SMB workforce.
Exhibit 7: 20 largest districts by SMB workforces, ranked by workforce change in 2025
Price: requires row-level block data access, available on request
Exhibit 8: Top/bottom 10 districts by worker-count indexed expansion/contraction in 2025
Price: requires row-level block data access, available on request
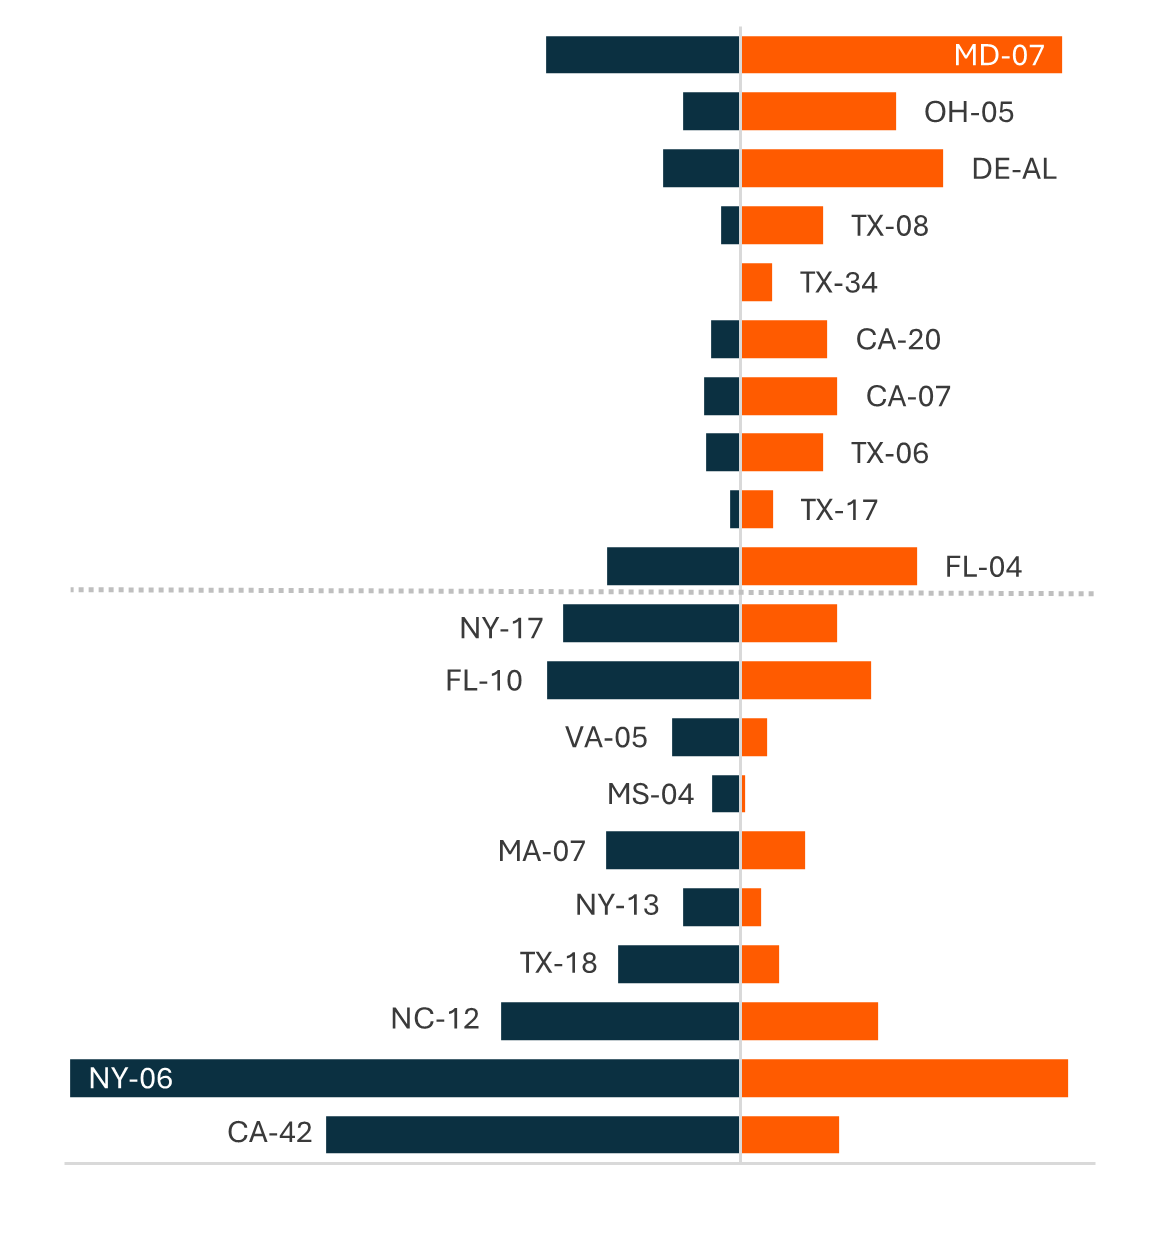
Exhibit 9: SMB workers gained and lost in 2025 among top/bottom 10 districts by worker-count indexed growth
Price: requires row-level block data access, available on request
District Dynamics and Consumer Impact
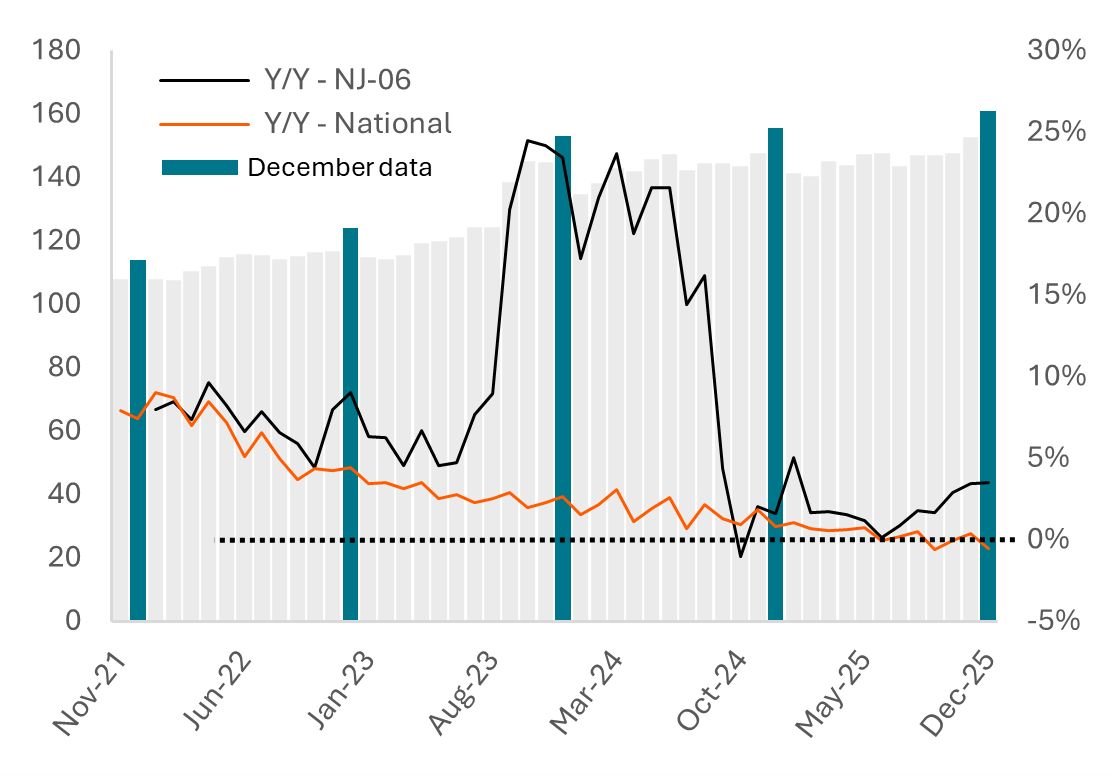
New Jersey’s 6th congressional district (NJ-06), made up by parts of Middlesex and Monmouth counties and with long-running representation by Democrat Frank Pallone, had an SMB workforce that grew more in 2025 than any of the 20 largest SMB workforces. The expansion of +3.5% in 2025 followed a period beginning early 2023 when Y/Y growth began to deviate from the national trend followed by rapid expansion in 2H 2023. This level of growth was not sustainable, yet the district was again able to produce above-trend rates of growth throughout 2025.
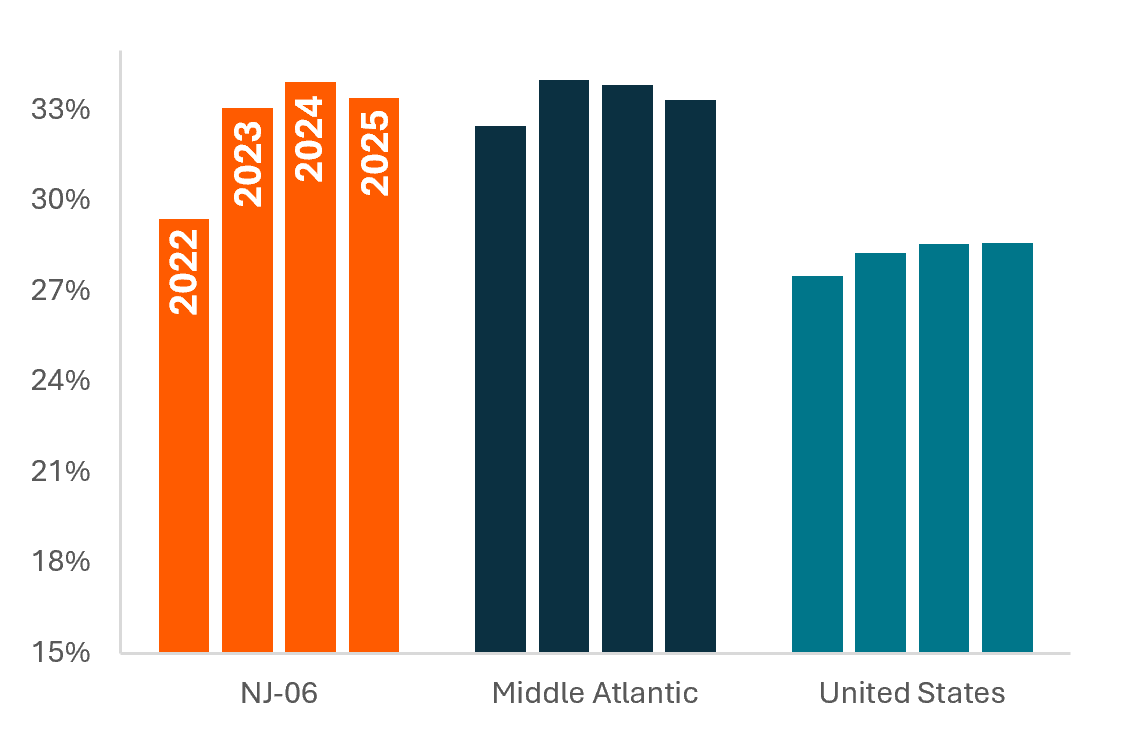
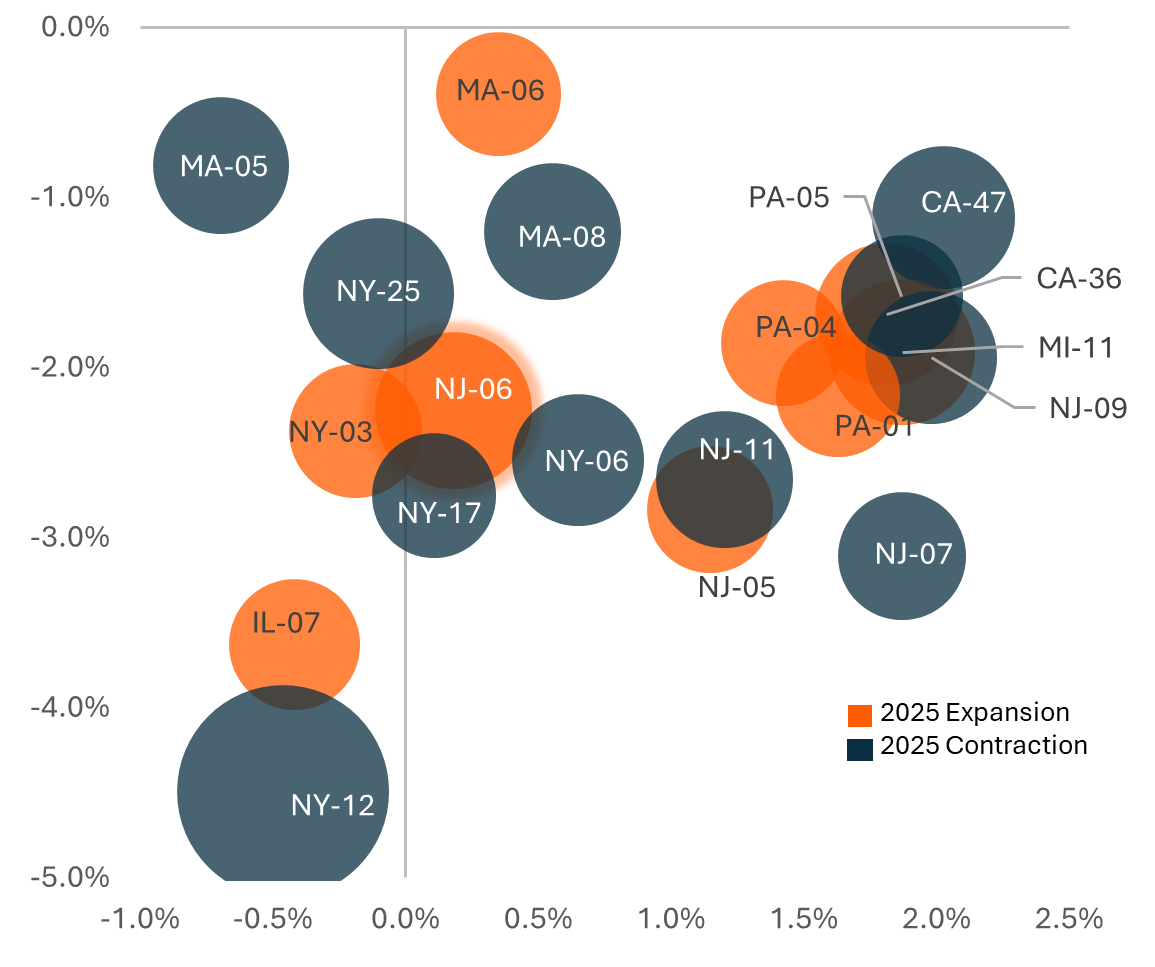
We use data on vehicle registrations to compare the mix of new vs. used vehicles as a relative measure of economic strength. Compared to the national level, or even the rest of the Middle Atlantic census division, NJ-06 had a sharp rise in the proportion of vehicle registrations that were new as its SMB workforce boomed in 2023 and again rose in 2024 before softening slightly in 2025. Average credit card transaction sizes and foot traffic per unique stores also provide measures of whether a strong SMB workforce is correlated with relative economic strength. At least in 2025, NJ-06’s SMB workforce growth did not translate into larger average ticket sizes or changes in foot traffic.
Exhibit 10: NJ-06 monthly indexed SMB workforce (bars, left) and Y/Y change (lines, right)
Price: requires row-level block data access, available on request
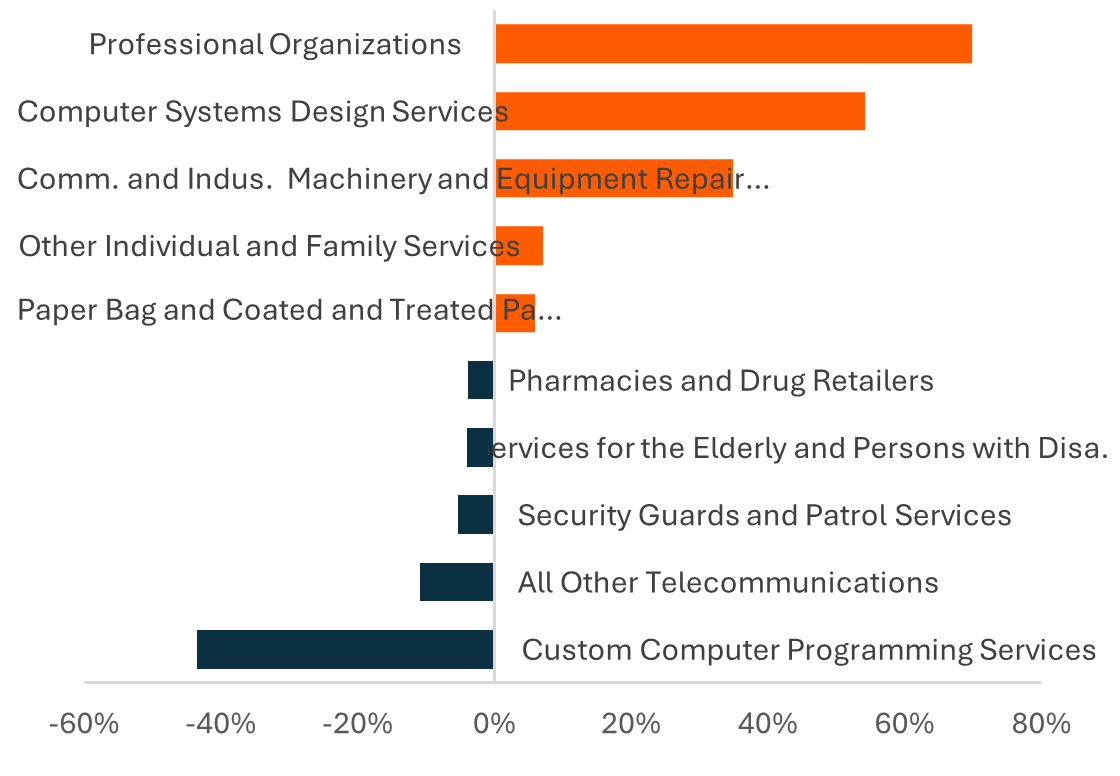
Exhibit 11: NAICS-6 sectors driving NJ-06 SMB workforce change in 2025
Price: requires row-level block data access, available on request
Exhibit 12: Annual mix of vehicle registrations (% new)
Price: requires row-level block data access, available on request
Exhibit 13: Y/Y change in foot traffic (Y-axis) and spend per credit card transaction (X-axis) for the 20 largest congressional districts by SMB workforce
Price: requires row-level block data access, available on request
Inflation of Consumer Staples Across Congressional Districts
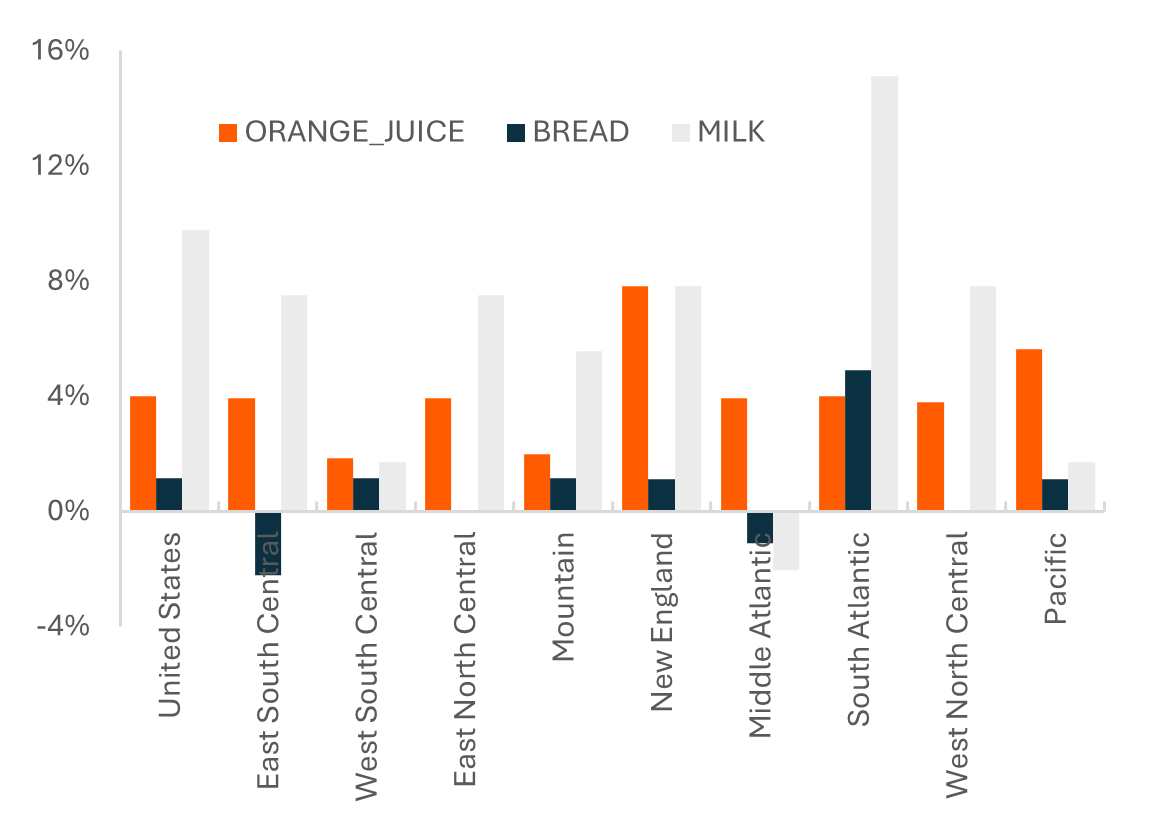
To complement our analysis of SMB workforce growth by congressional districts, we examined changes in the prices of everyday consumer staples—bread, milk, and orange juice—using point-of-sale transaction data at the zip code level, aggregated at the national, census division, and down to the district level.
The results show that price inflation for staples varies meaningfully across districts, even within region. Some districts experienced consistent price increases across all three categories, while others saw flat or declining prices in one or more items.
Median price changes were often uncorrelated to regional SMB workforce change. For example, Washington’s 10th district had the largest and most consistent price increases across categories while sitting in a region where the SMB workforce has had either the slowest growth or largest contraction in recent years.
Exhibit 14: Average two-year change in median prices of select consumer staples at national and census division levels. Divisions ordered by 2025 SMB workforce change.
Price: requires row-level block data access, available on request
Exhibit 15: Top/bottom 10 congressional districts by change in median prices of select consumer staples
Price: requires row-level block data access, available on request
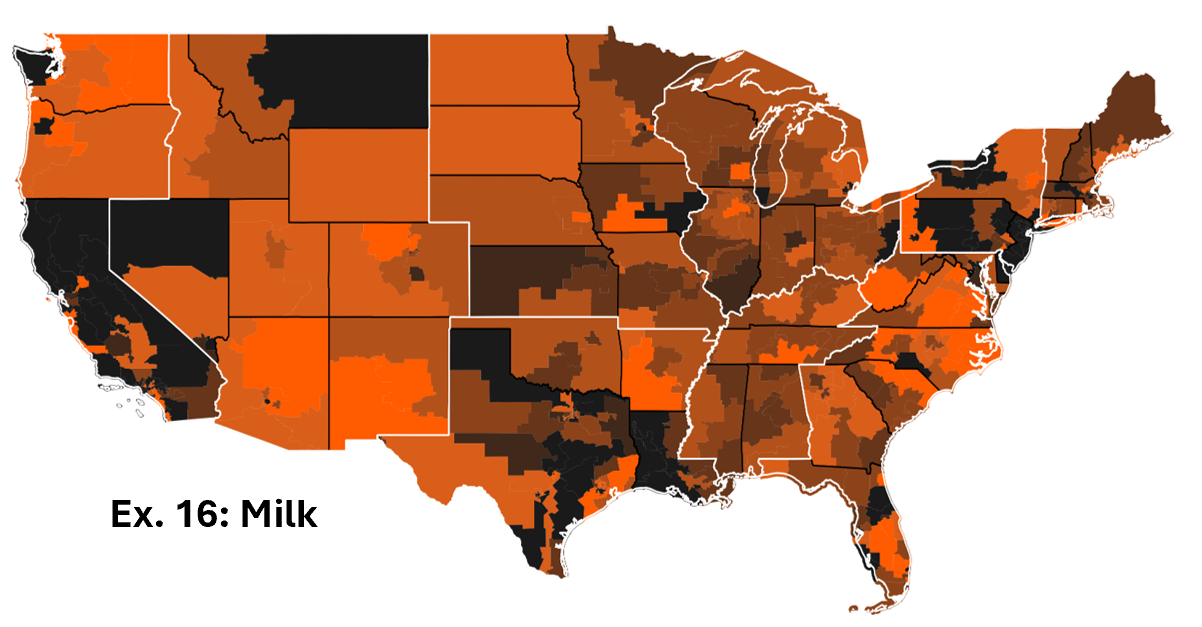
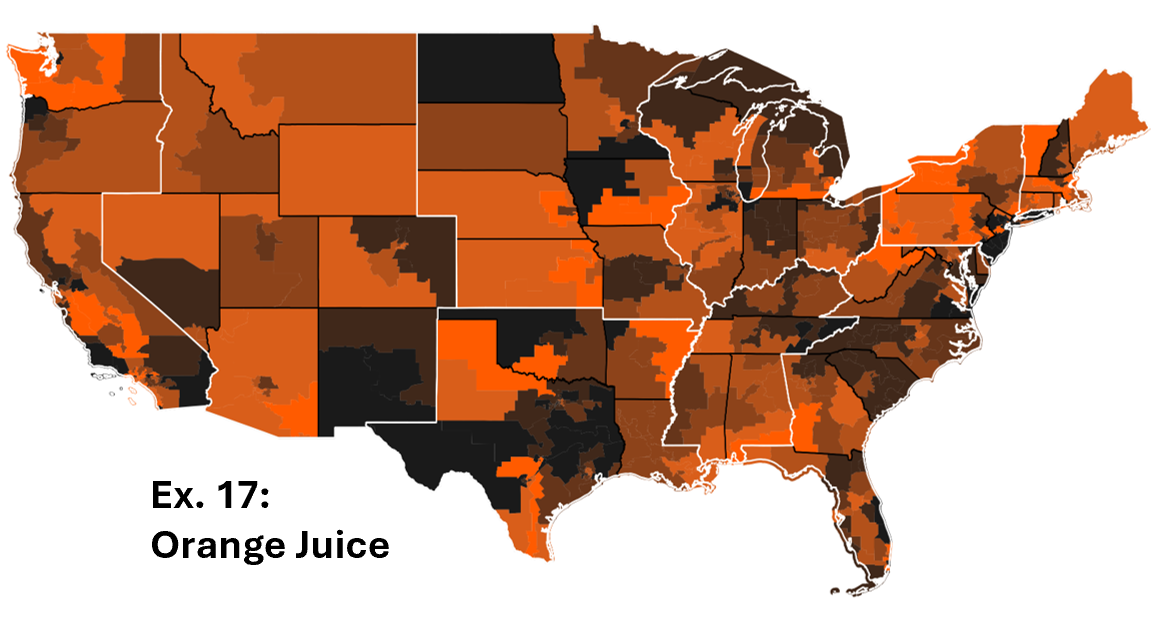
Exhibit 16-18: Average two-year change in median prices of consumer staples by congressional districts
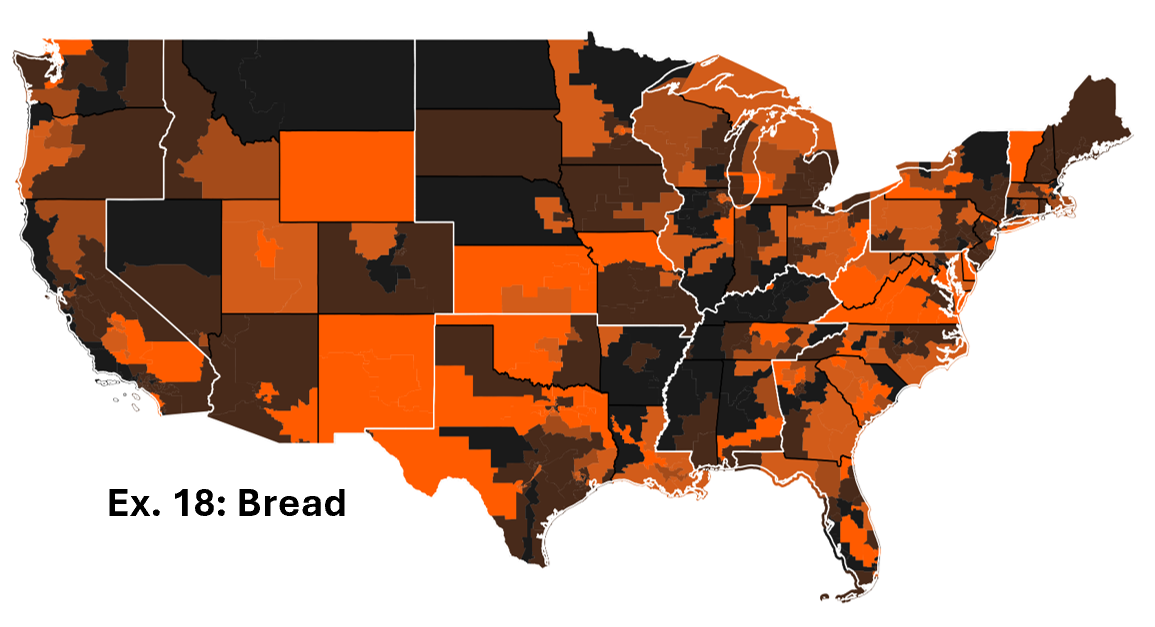
Price: requires row-level block data access, available on request
Footnotes
-
Congressional districts ranked include AK, HI, and exclude territories (PR, GU, etc.)
-
Other Services includes a broad range of personal, repair, religious, grantmaking, and civic activities not classified elsewhere. Examples include auto/equipment repair, laundry/drycleaning, personal care (salons, spas), pet care, and private households’ employment. https://www.census.gov/naics/?input=81&year=2022&details=81
Questions?
Contact us at support@carbonarc.co if you have any questions!
CARARC-20260122-SMBCD-0001