Company Spotlight
Carbon Arc Data Assets: Credit Card – US Complete Panel, Credit Card – EU Detailed Panel, POS – Instore and Online, Digital Advertising, Clickstream, TikTok Shop
U.S. Growth Stable from FY2Q26, EU Spend Declines
December 22, 2025
Executive Summary
Deckers Brands (DECK) continued its revenue momentum in October’s 2QFY26 print with 9.1% net sales growth driven by its international and wholesale segments, while U.S. and DTC declined Y/Y1. Carbon Arc data shows strong Black Friday performance, particularly for Hoka, driving a slight recovery in U.S. DTC performance. However, EU DTC spend decelerated significantly quarter-to-date in 3Q26 and wholesale retail categories are showing negative signals in POS and card spend, suggesting overall net performance likely declined from FY2Q26.
Digital engagement is improving despite declining ad spend; however, TikTok shop data shows lower-priced Steve Madden undercutting Ugg even with minimal advertising volume. Ugg is also showing weaker performance with men, after a successful advertising campaign with Post Malone last November drove a strong 3QFY252.
Key Takeaways
-
QTD credit card spend at Deckers Brands accelerated +2.4 pp Y/Y from 2QFY26, suggesting slight recoveries in the U.S. and direct sales segments, driven by a strong Black Friday weekend for Hoka.
-
POS spend suggests slight Y/Y weakness for Ugg at mass merchandisers in both spend and ticket. Retail category credit card spend trends show slight growth deterioration from 2QFY26, with spend momentum falling a couple weeks after the print.
-
DECK’s spend growth in Western Europe is slowing due to Y/Y transaction declines, even as its international business remains strong.
-
Despite Y/Y declines in digital advertising spend across platforms for Ugg, Hoka, and the broader footwear category, digital engagement is improving, led by increases in session duration.
-
Ugg and Hoka underperform their advertising spend on TikTok, with lower-priced competitor Steve Madden taking market share from Ugg during the 2025 holiday shopping season.
-
New England is by far the best-performing region for DECK and footwear retail spend but contributes a small proportion of DECK sales.
-
In 2025, a larger share of Ugg’s spend and engagement came from lower-income consumers and women, following a successful Post Malone campaign last year that drove strong growth among men.
Direct Sales and Brand Insights
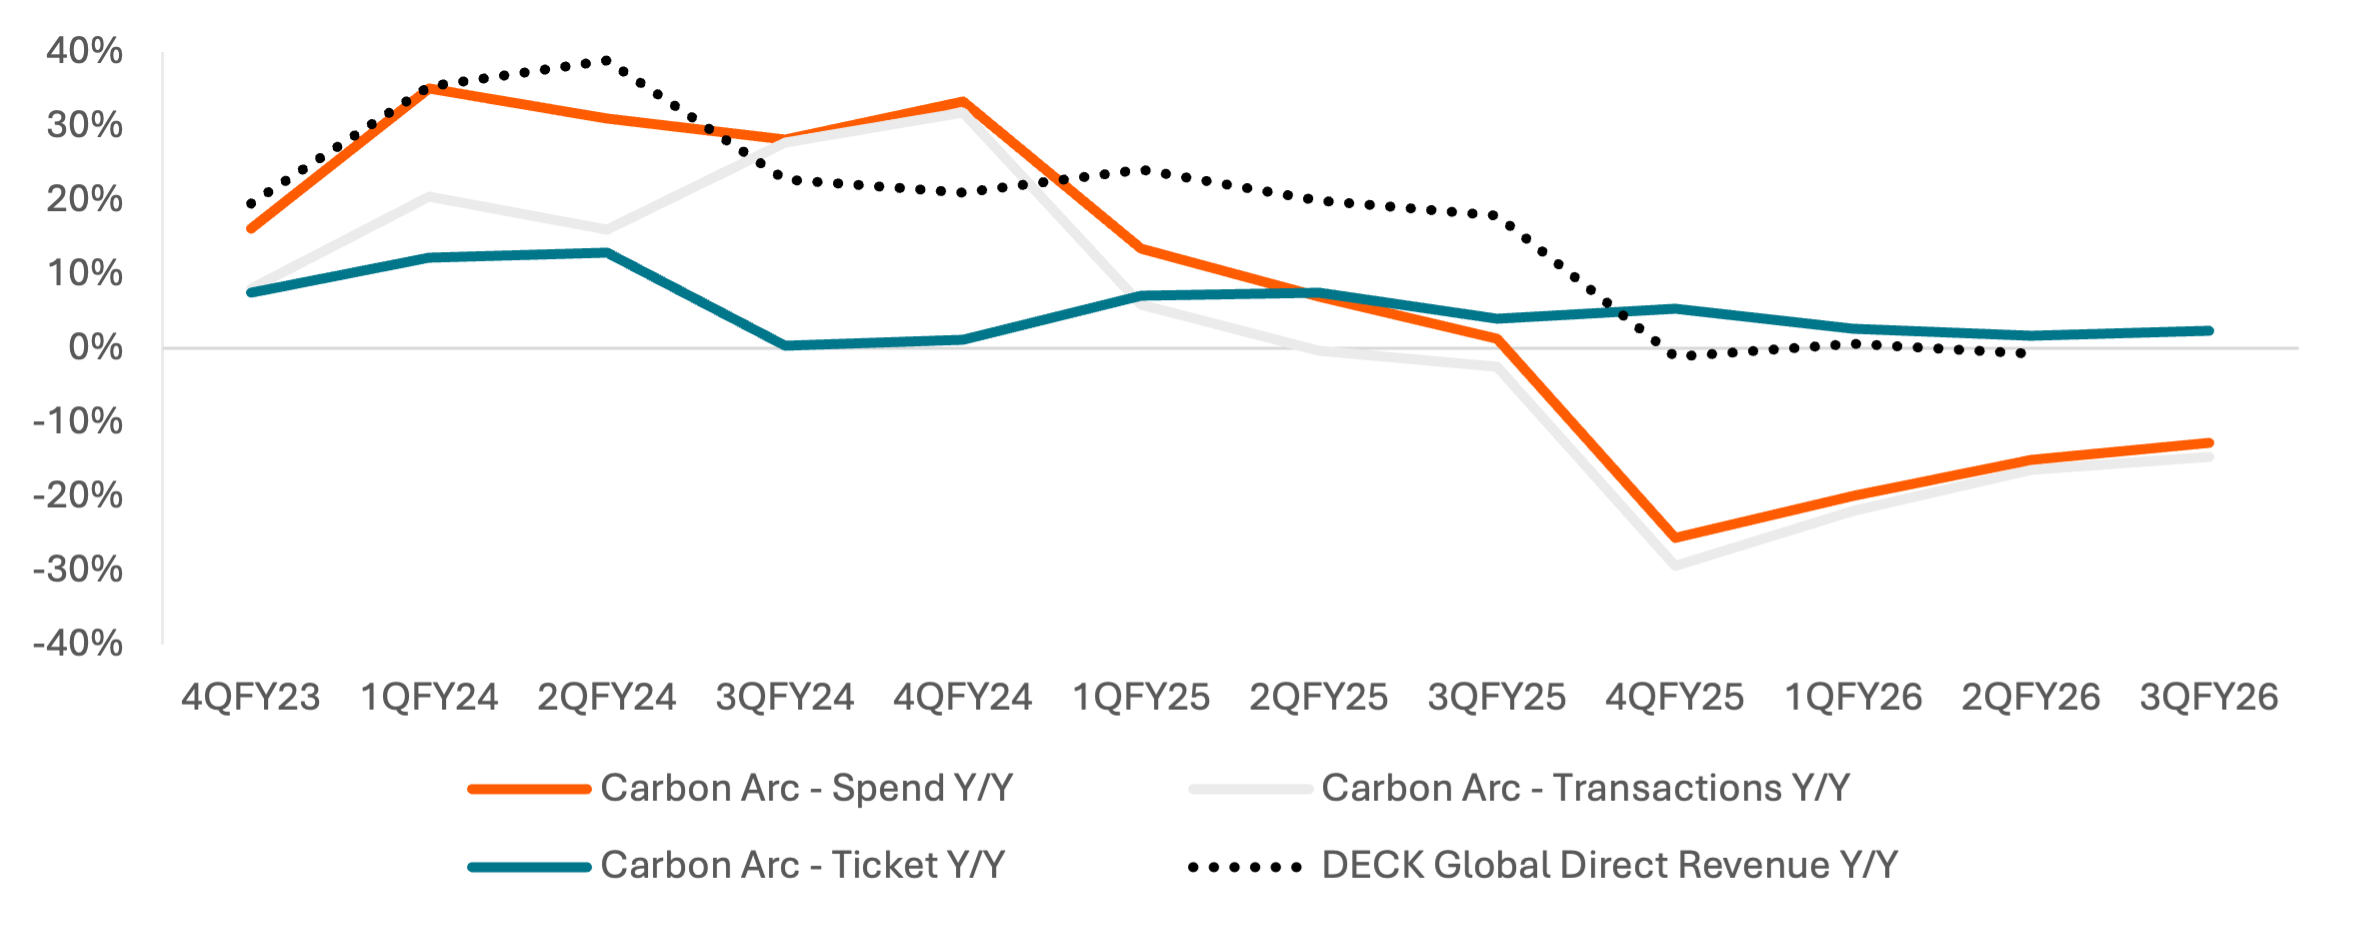
Carbon Arc credit card data shows a +2.4 pp acceleration in direct U.S. revenue in 3QFY26 (-15.1% to -12.7% Y/Y), suggesting a slight Y/Y increase in DTC sales and similar recovery from a Y/Y loss in U.S. sales in 2Q. Ticket size increased a modest 2.3% Y/Y, a +0.7 pp acceleration from 2Q. While transaction growth is recovering, ticket size is a critical driver with the U.S. and DTC reported segments both seeing low-single-digit losses Y/Y in 2Q.
Carbon Arc’s credit card panel suggests Hoka is significantly outperforming Ugg in DTC sales growth, despite Ugg’s Y/Y increases in ticket in the 3 months prior to December. Both brands saw improved Y/Y spend growth in November and December compared with earlier in the fall, suggesting consumers placed greater emphasis on maintaining their purchasing habits during holiday shopping.
Exhibit 1: DECK Global Direct Revenue Growth vs. Card Arc Credit Card – US Complete Panel
Price: 19.36 Tokens
Exhibit 2: Hoka Monthly Credit Card Panel Spend
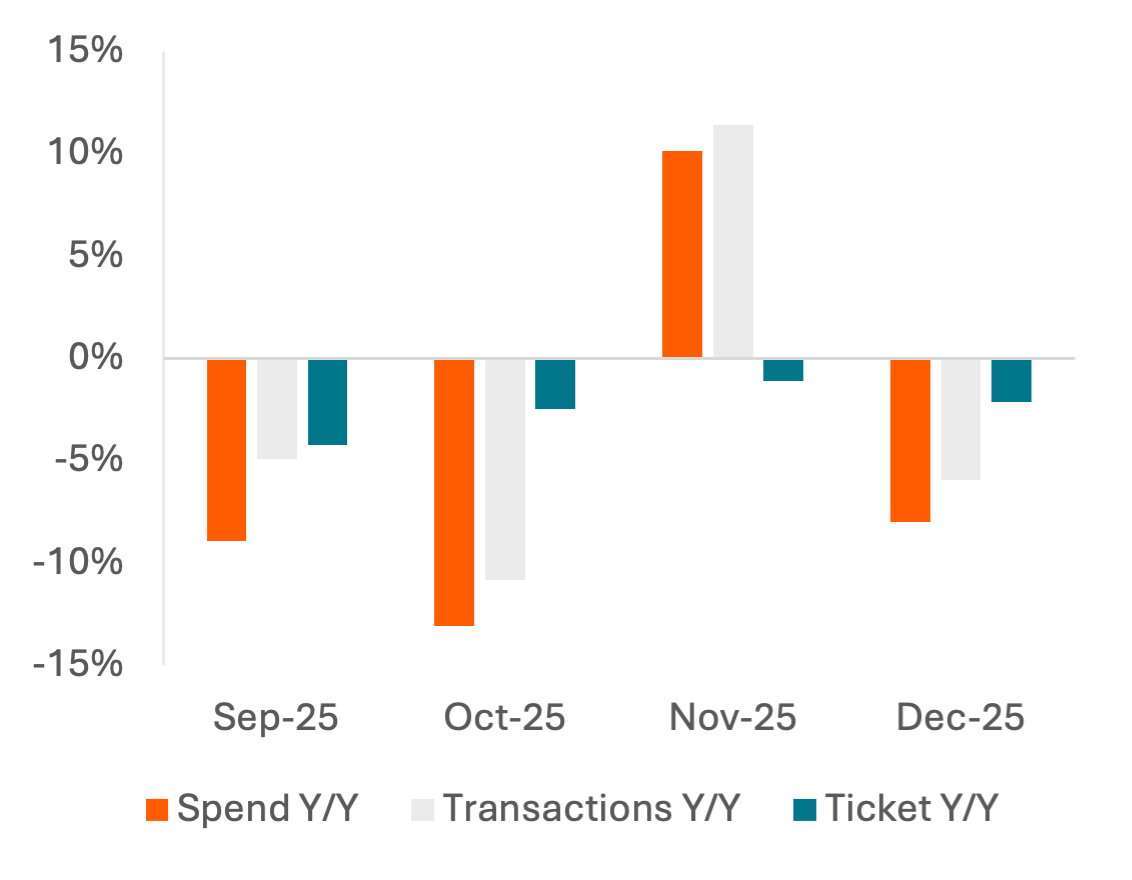
Price: 9.98 Tokens
Exhibit 3: Ugg Monthly Credit Card Panel Spend
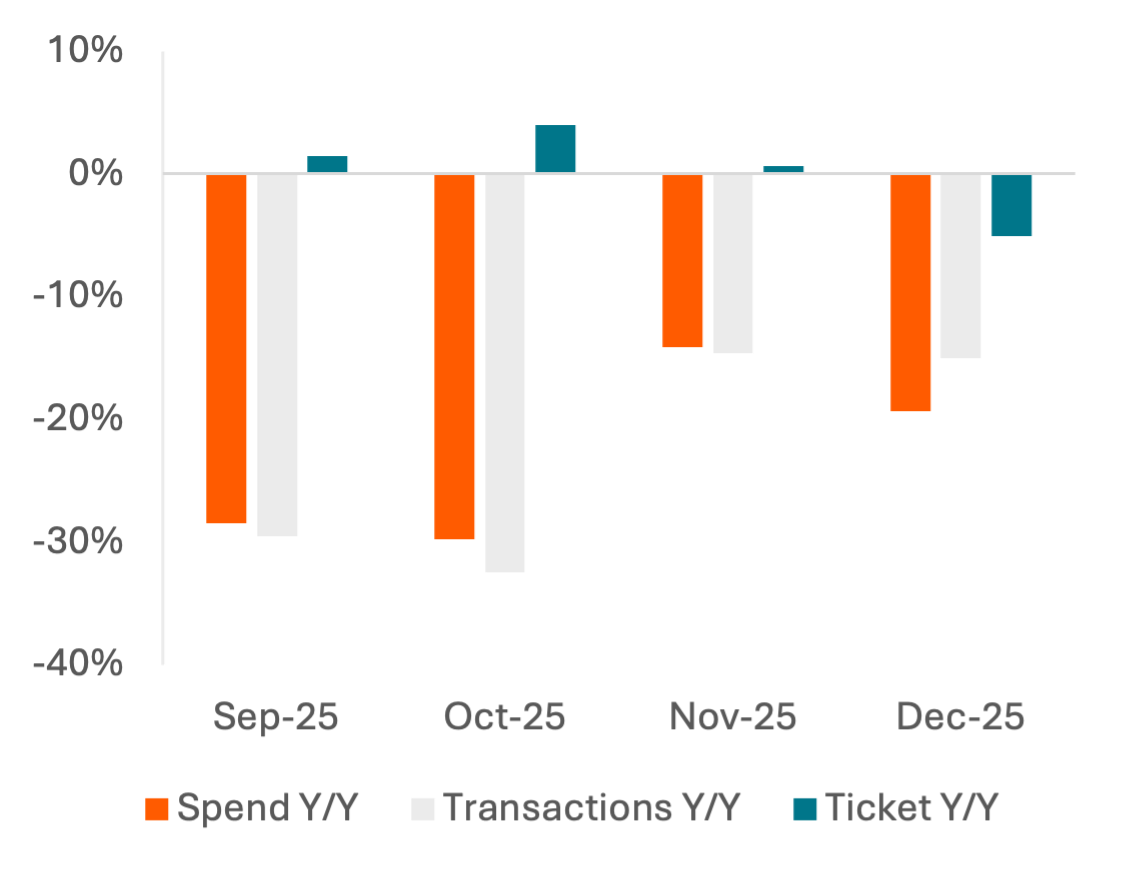
Price: 9.98 Tokens
Momentum, In-Store, and International Sales
Daily credit card spend data reinforces the idea that consumers are emphasizing holiday spending over other discretionary consumption. Spend at both Hoka and Ugg accelerated significantly over Black Friday but Hoka substantially outperformed, with spend over the last 2 weeks of November growing 50% vs. the same period in 2024. However, both brands have returned to pre-holiday spending levels, suggesting consumers were particularly motivated by discounts in 2025.
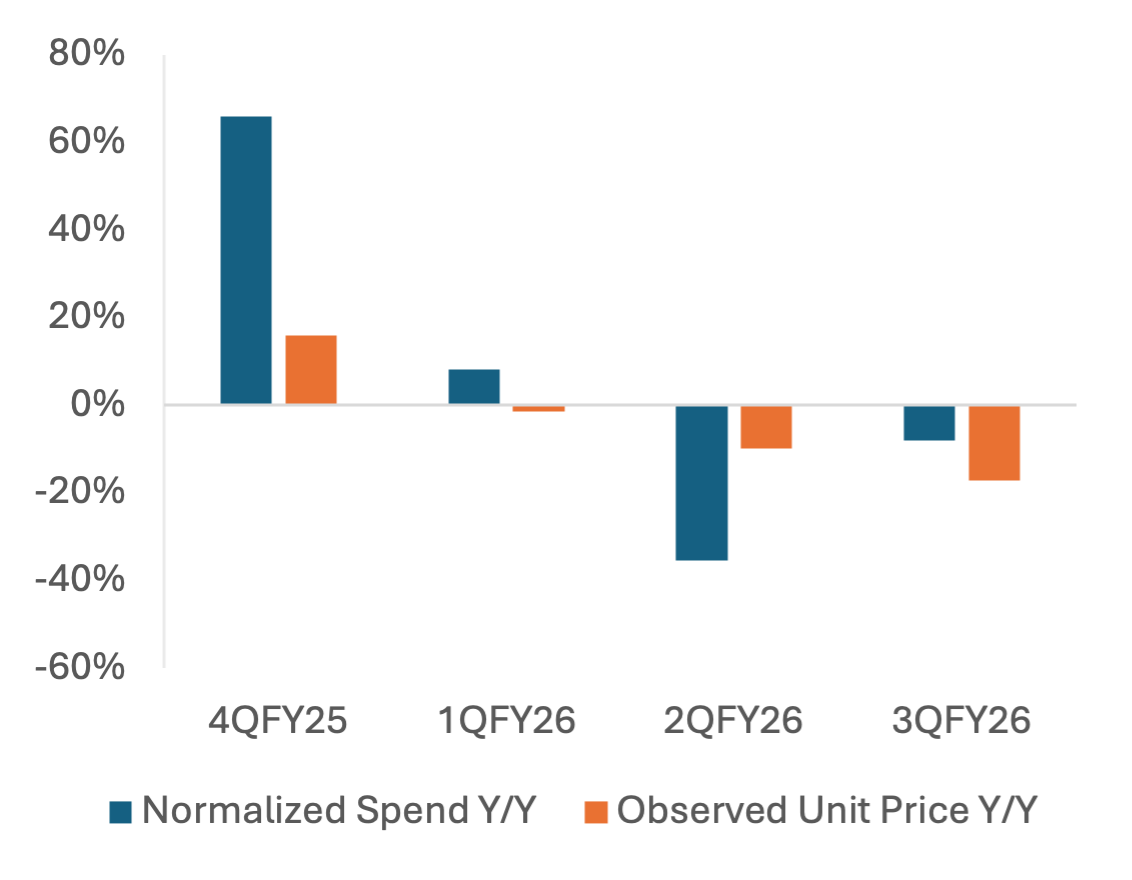
POS spend suggests that Ugg consumers are spending less Y/Y than earlier in 2025, driven by lower-frequency purchases and less-expensive items.
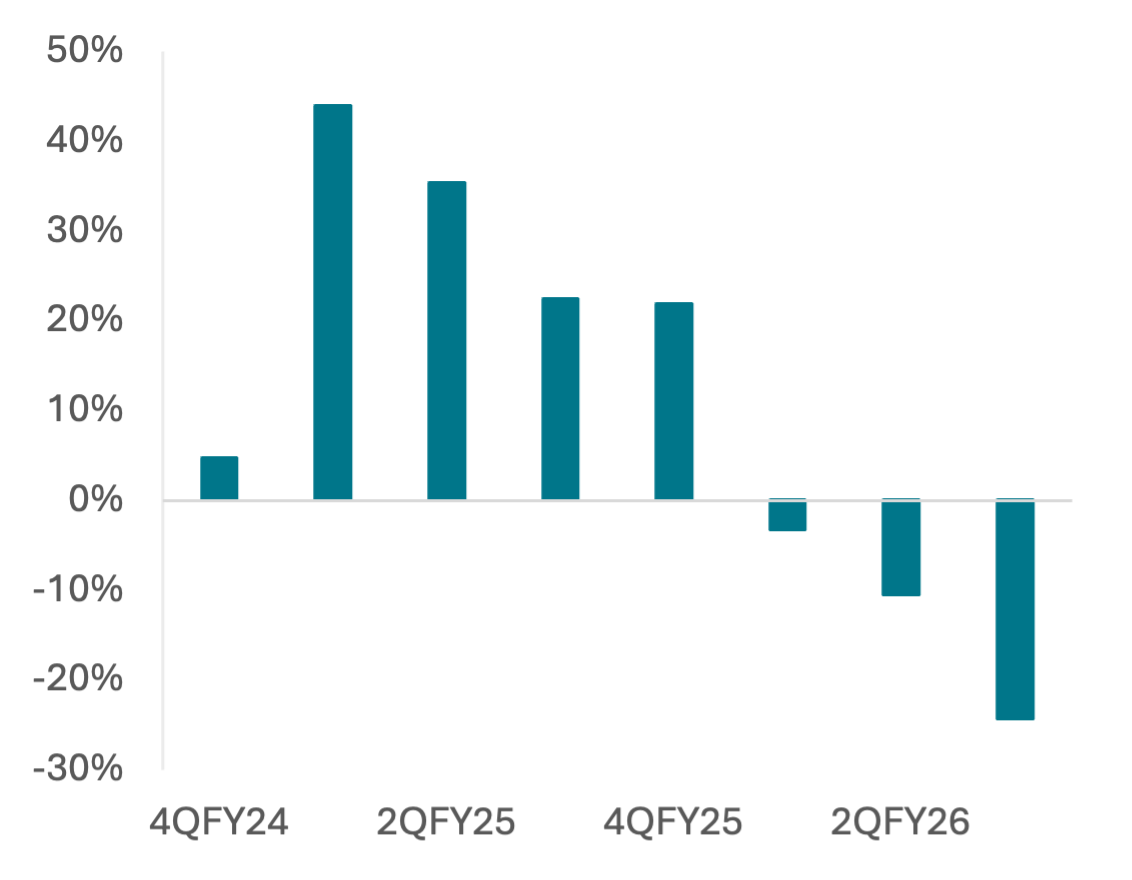
DECK EU credit card spend Y/Y growth decelerated 15pp in 3QFY26, it’s 3rd consecutive quarter of deceleration and Y/Y declines, suggesting continued international growth will need to be driven by Asia. The spend deceleration is driven by transactions, as ticket increased slightly Y/Y in December and decreased single-digits Y/Y in October and November.
Exhibit 4: Credit Card Panel Spend 14-Day Moving Average, Y/Y Growth
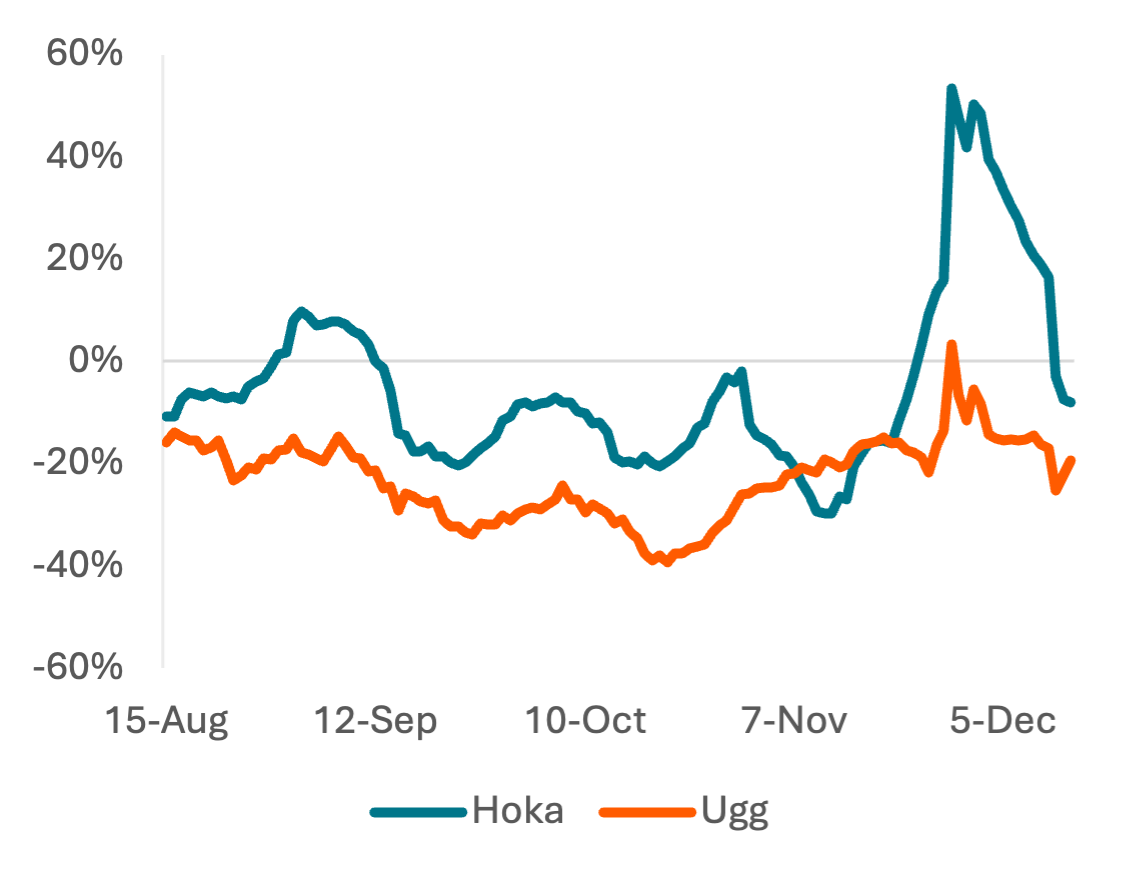
Price: 4.99 Tokens
Exhibit 5: Ugg Normalized POS – Online Spend and Observed POS Unit Price
Price: 26.90 Tokens
Exhibit 6: DECK EU Credit Card Panel Spend Y/Y Growth
Price: 94.69 Tokens
Exhibit 7: DECK Monthly EU Credit Card Panel Spend
Price: 83.22 Tokens
Retail Category Insights
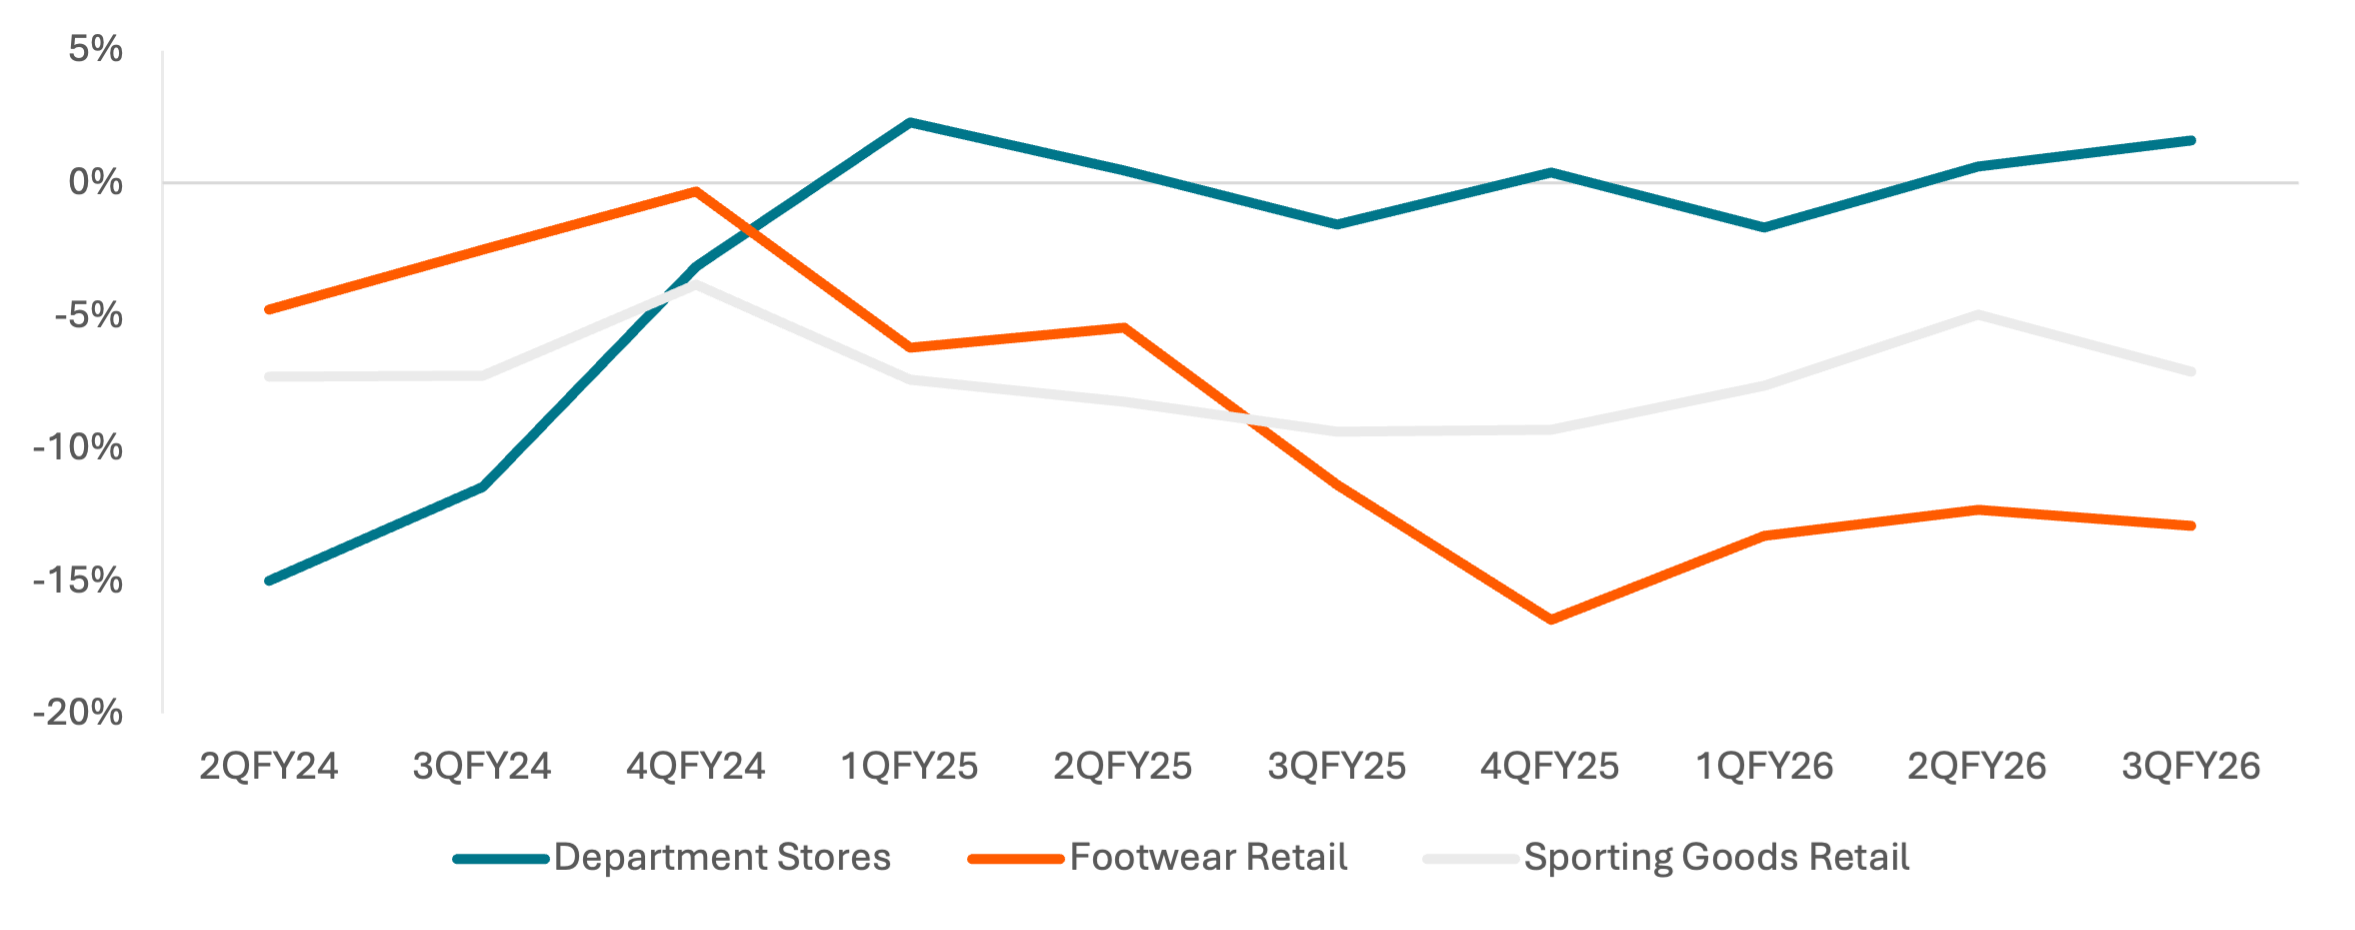
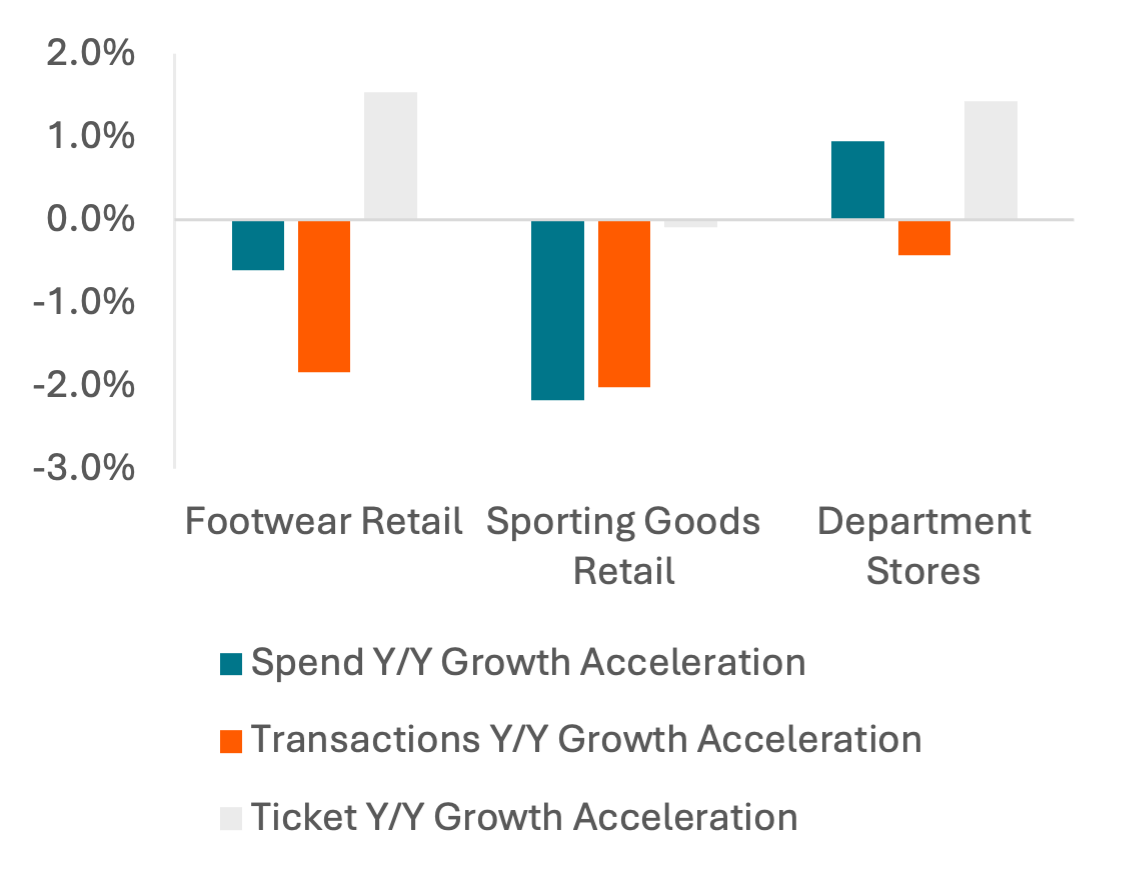
Category-level spending trends show potential weakness for DECK’s wholesale business in 3QFY26. Y/Y spend growth accelerated +0.9 pp at Department Stores Q/Q but decelerated – 0.6 pp in Footwear Retail and – 2.2 pp in Sporting Goods Retail. Ticket growth is improving vs. FY2Q while transaction growth is declining. Sporting goods retail is the most negatively impacted with ticket growth consistent from FY2Q and transaction growth declining ~2 pp. While footwear retail and department store transaction growth is also declining vs. FY2Q, ticket growth accelerated > 1 pp.
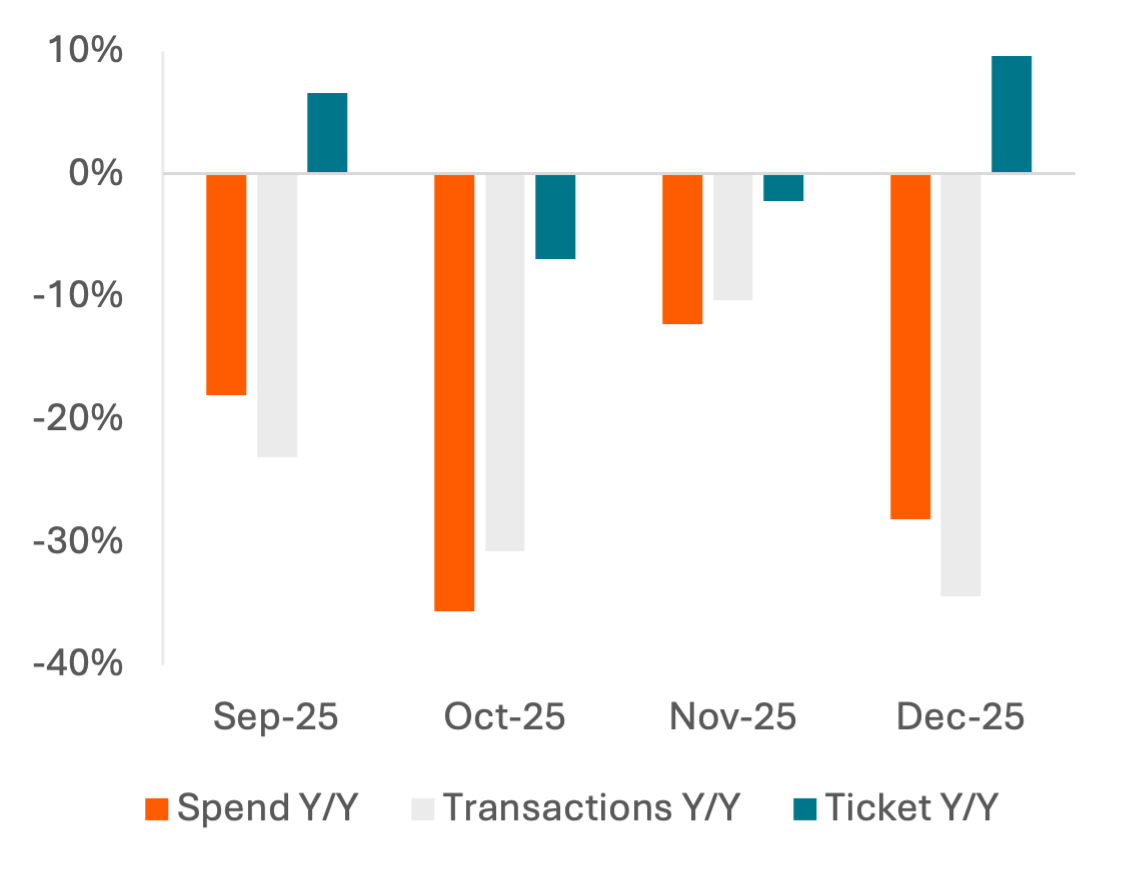
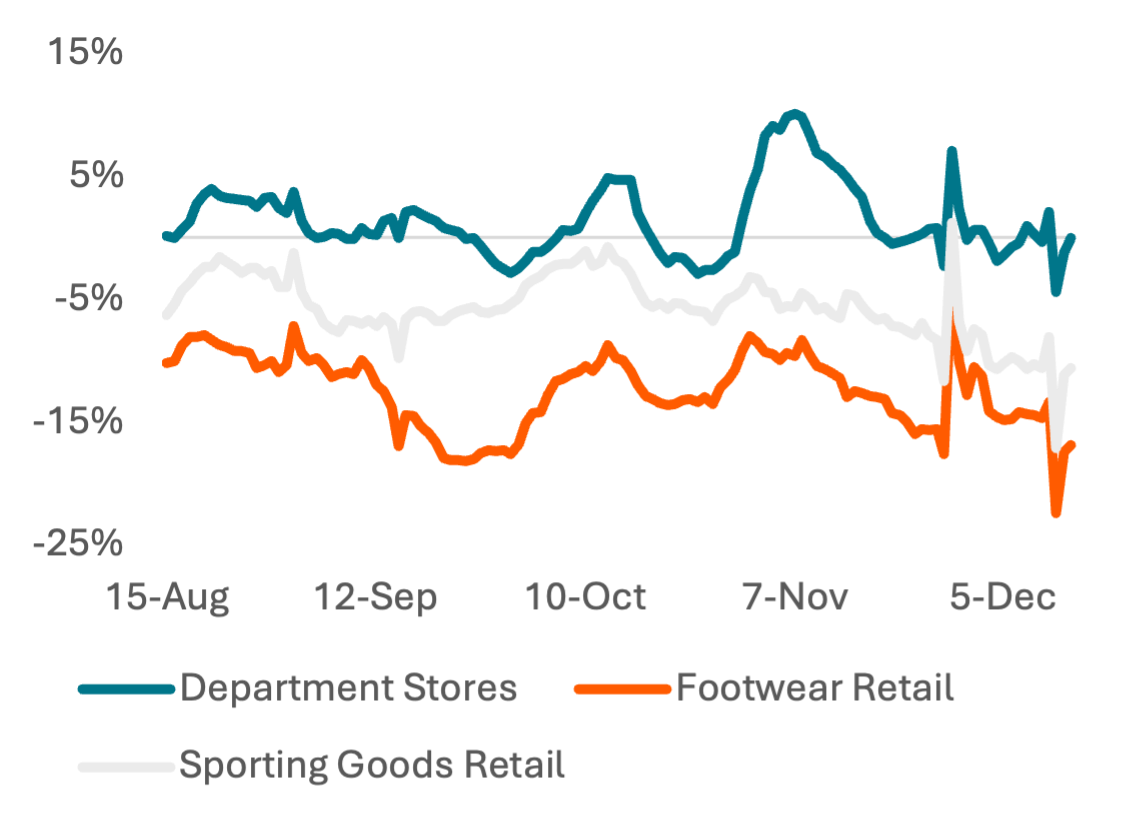
Daily card spend trends show slight improvement during Black Friday but momentum flat or worsening since DECK’s print on October 23. Department store spend growth has stayed consistent at ~flat to LSD panel spend growth, but footwear retail and sporting goods retail have both deteriorated in momentum, a better sign for Ugg than for Hoka but a negative overall sign for both brands this quarter.
Exhibit 8: Quarterly Credit Card Spend Growth by Retail Category
Price: 28.72 Tokens
Exhibit 9: 3QFY26 Retail Q/Q Acceleration in Y/Y Growth
Price: 23.46 Tokens
Exhibit 10: Credit Card Panel Spend 14-Day Moving Average, Y/Y Growth
Price: 12.98 Tokens
Advertising Spend and Digital Engagement
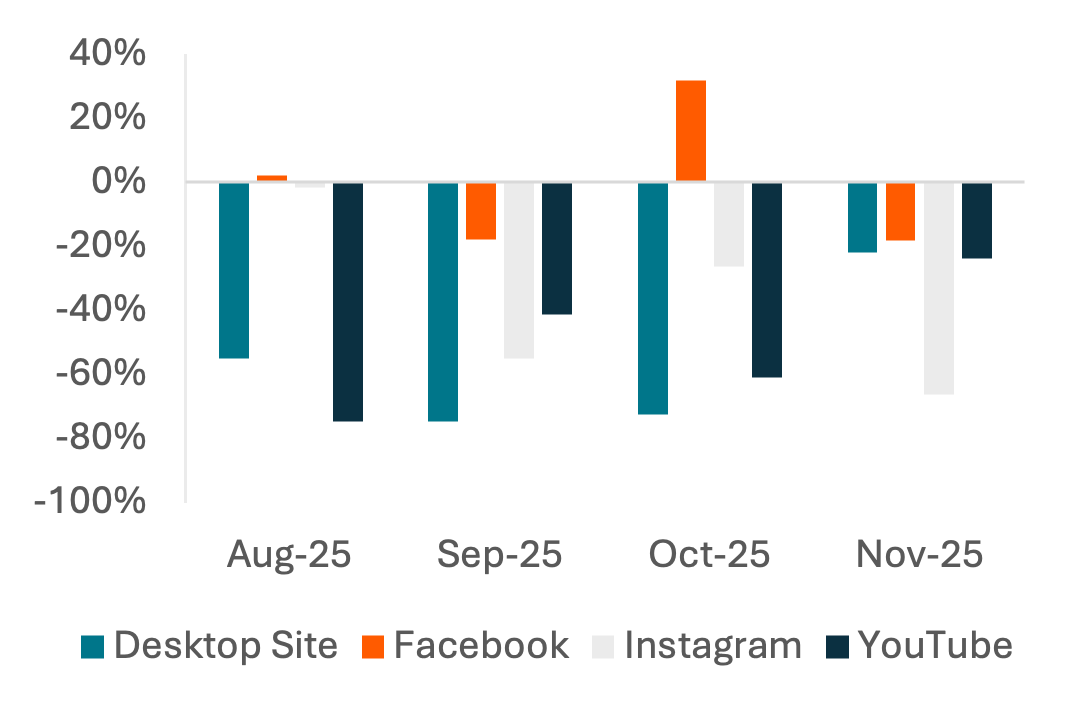
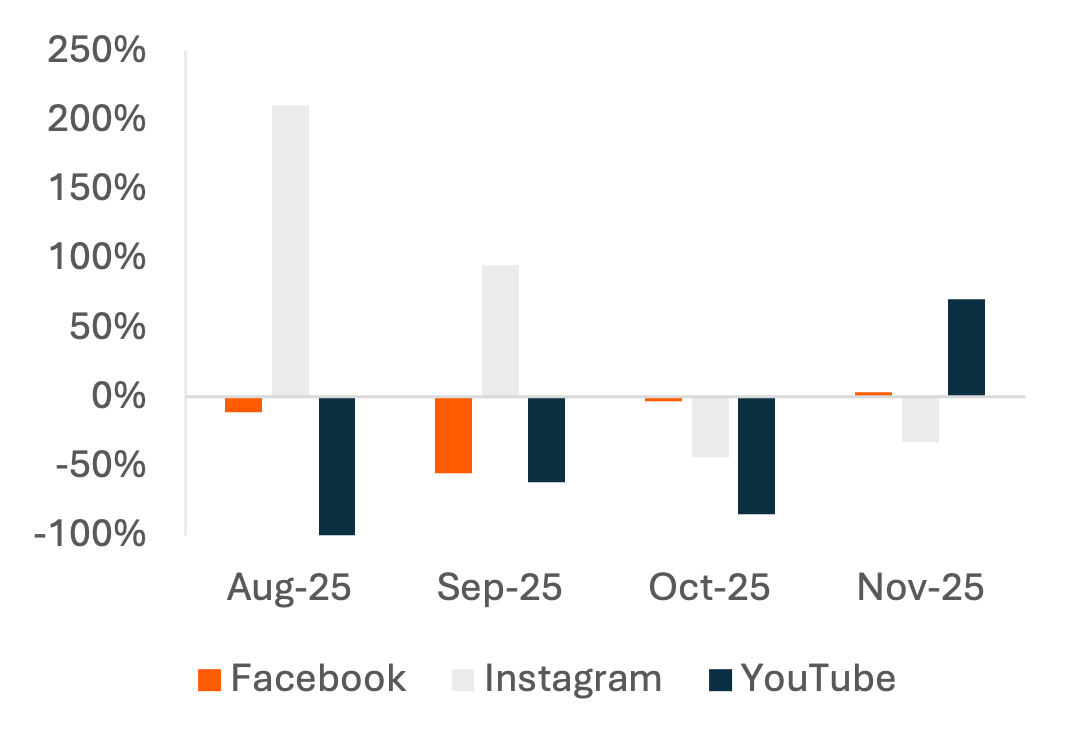
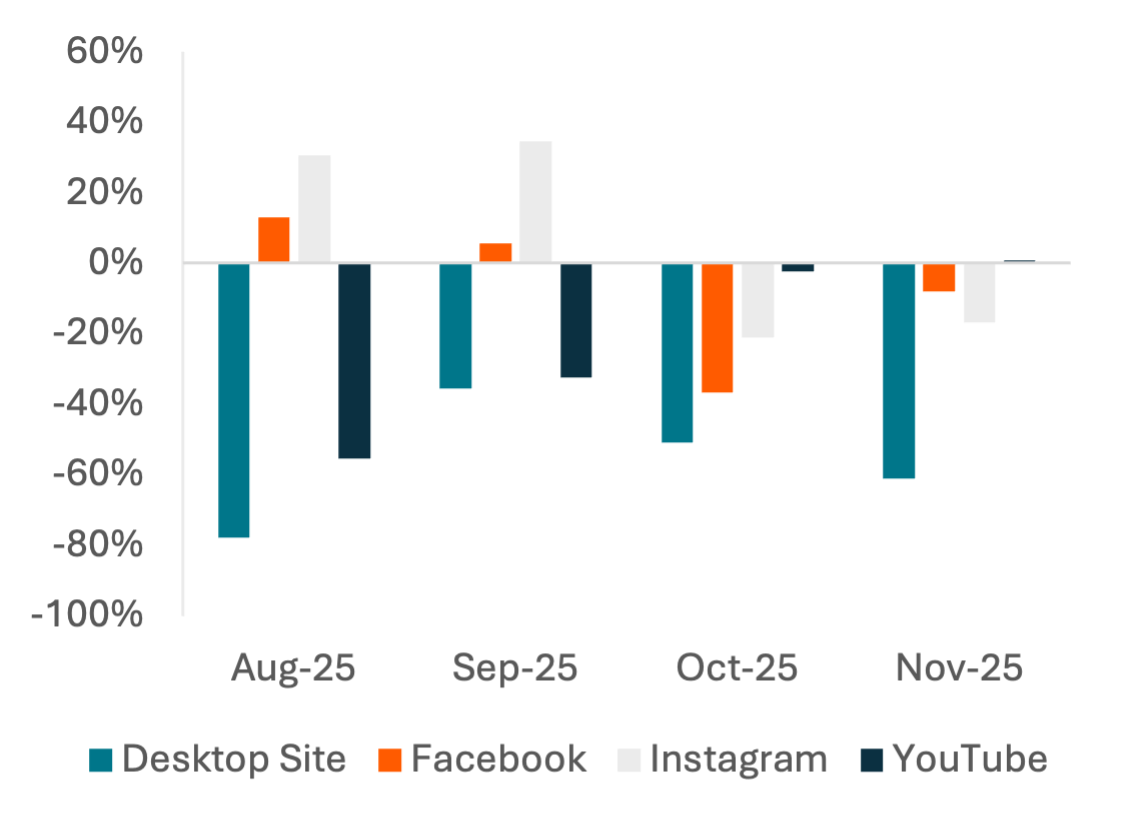
The modest spend acceleration comes despite significant digital ad spend contractions for Hoka, Ugg, and the footwear industry writ large. Ugg sharply increased Y/Y advertising spend on YouTube in November, while slightly reducing Meta spend and nearly eliminating direct website ads. Apart from an increase on Facebook in August and October, Hoka has cut ad spend on its key digital platforms.
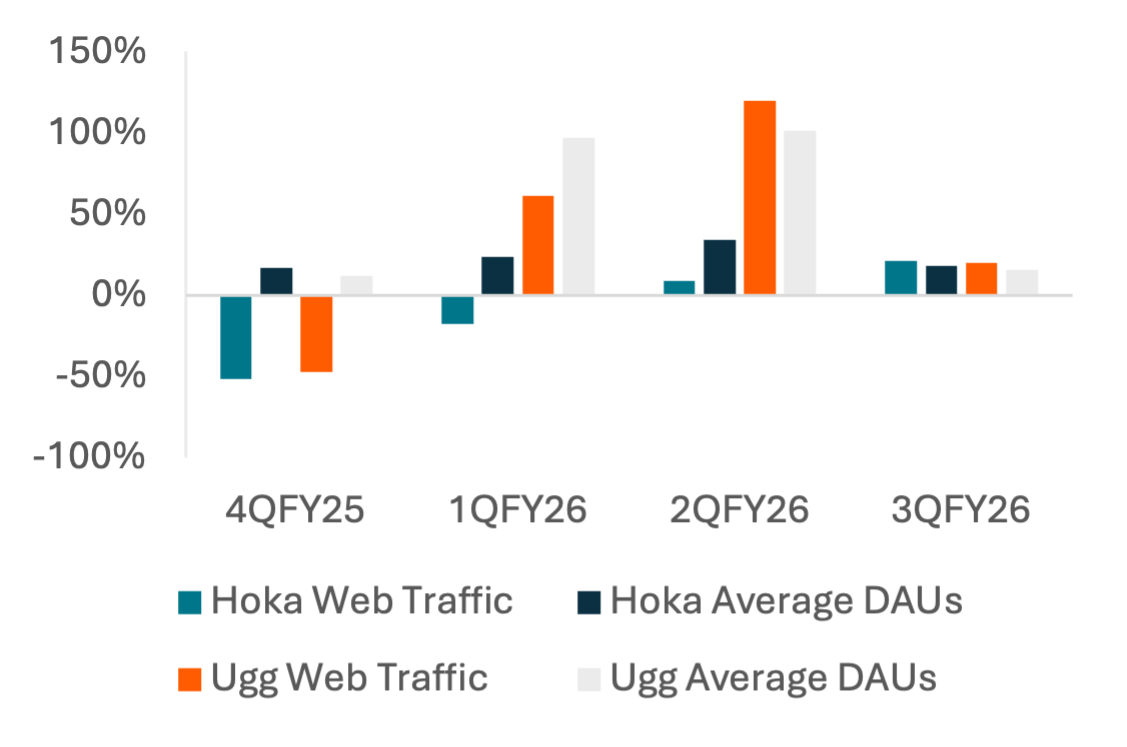
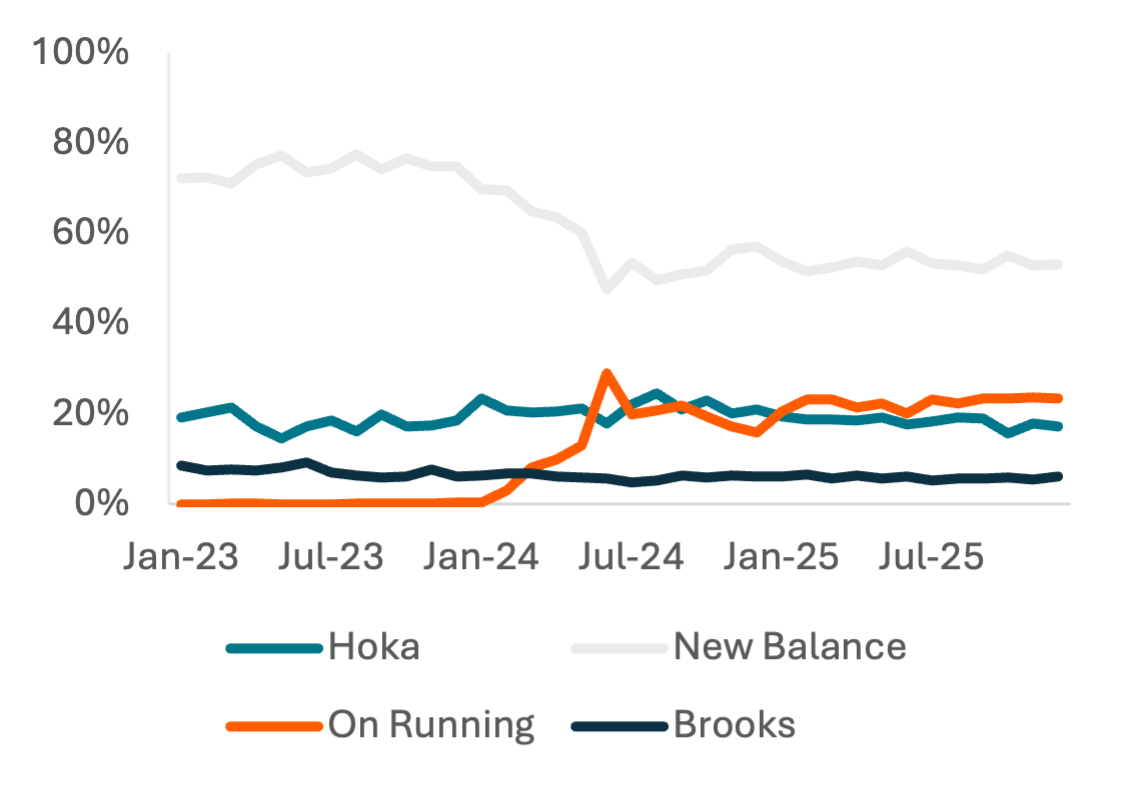
Both brands have shown modest gains in website traffic and DAUs in 3Q, with DAU growth decelerating but website traffic accelerating, suggesting improvement in session duration. Despite the Y/Y improvement, Hoka has failed to gain market share against other running shoe brands and has lost several points of share since summer 2024.
Exhibit 11: Hoka Digital Ad Spend Growth by Platform
Price: 4.99 Tokens
Exhibit 12: Ugg Digital Ad Spend Growth by Platform
Price: 4.99 Tokens
Exhibit 13: Footwear Brands Digital Ad Spend Growth by Platform
Price: 4.99 Tokens
Exhibit 14: Website Engagement Y/Y Growth
Price: 9.98 Tokens
Exhibit 15: Web Traffic Market Share
Price: 8.68 Tokens
TikTok Advertising and Spend Market Shares
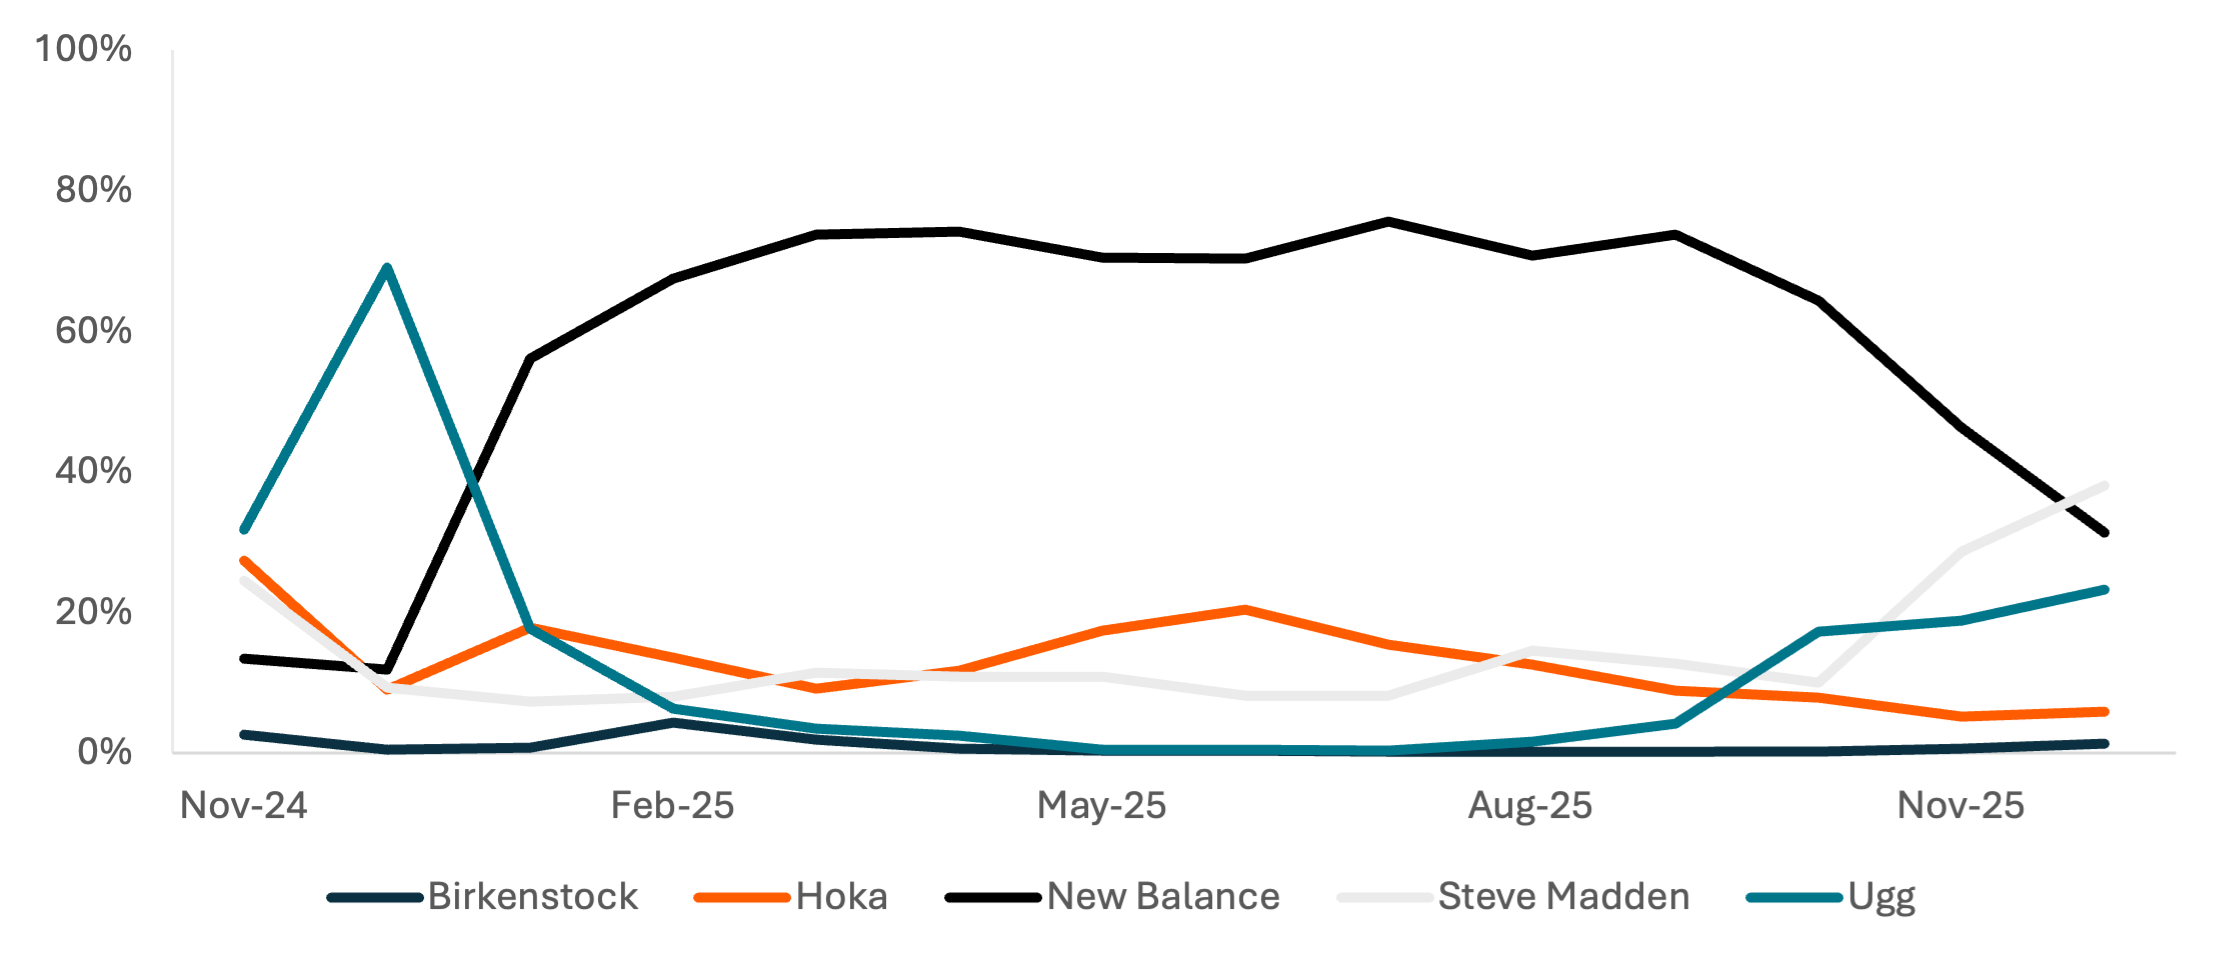
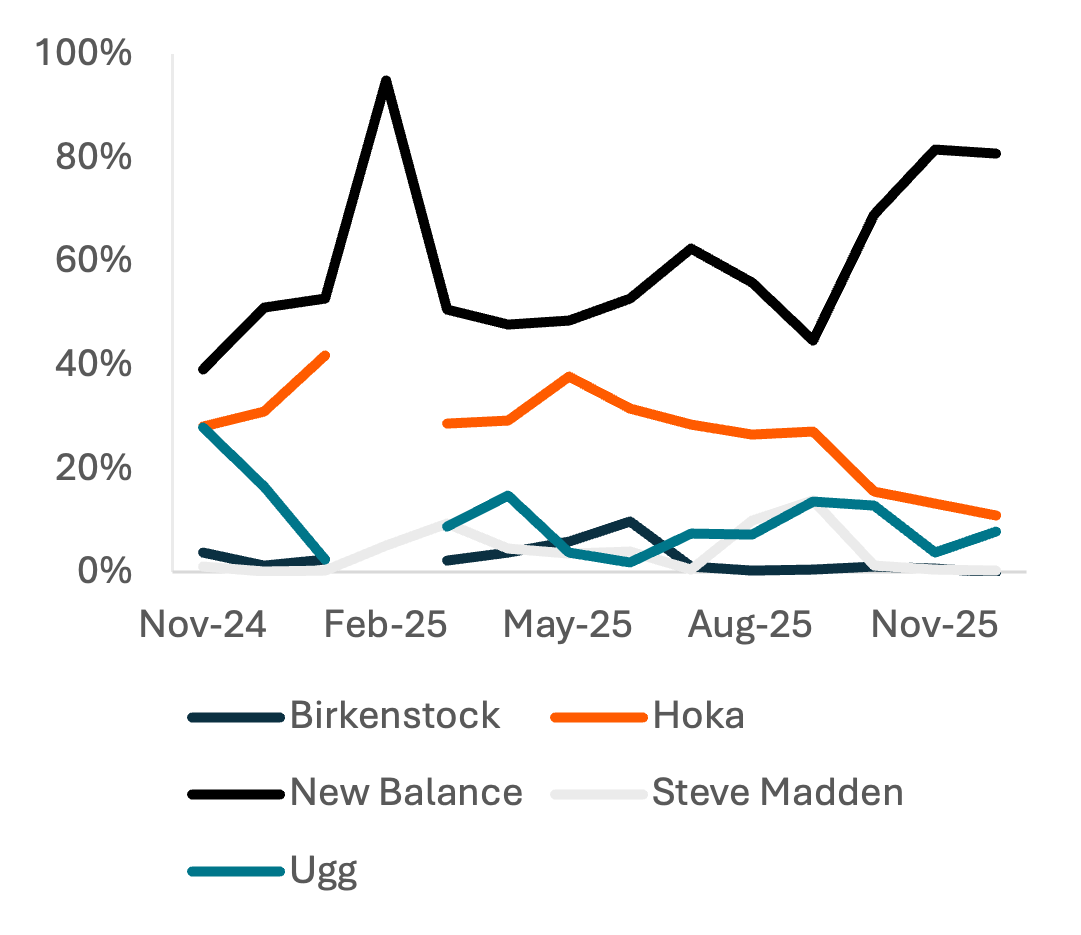
Comparing Ugg and Hoka to competitors who also advertise frequently on TikTok, both brands tend to underperform on advertising spend when looking at estimated revenue on TikTok Shop. Ugg gains significant market share during the holiday and winter season, but Steve Madden, which offers similarly-styled products at a lower price point, has gained significantly more market share in fall 2025. Despite selling shearling slippers, Birkenstock does not appear to be a serious competitor in the channel.
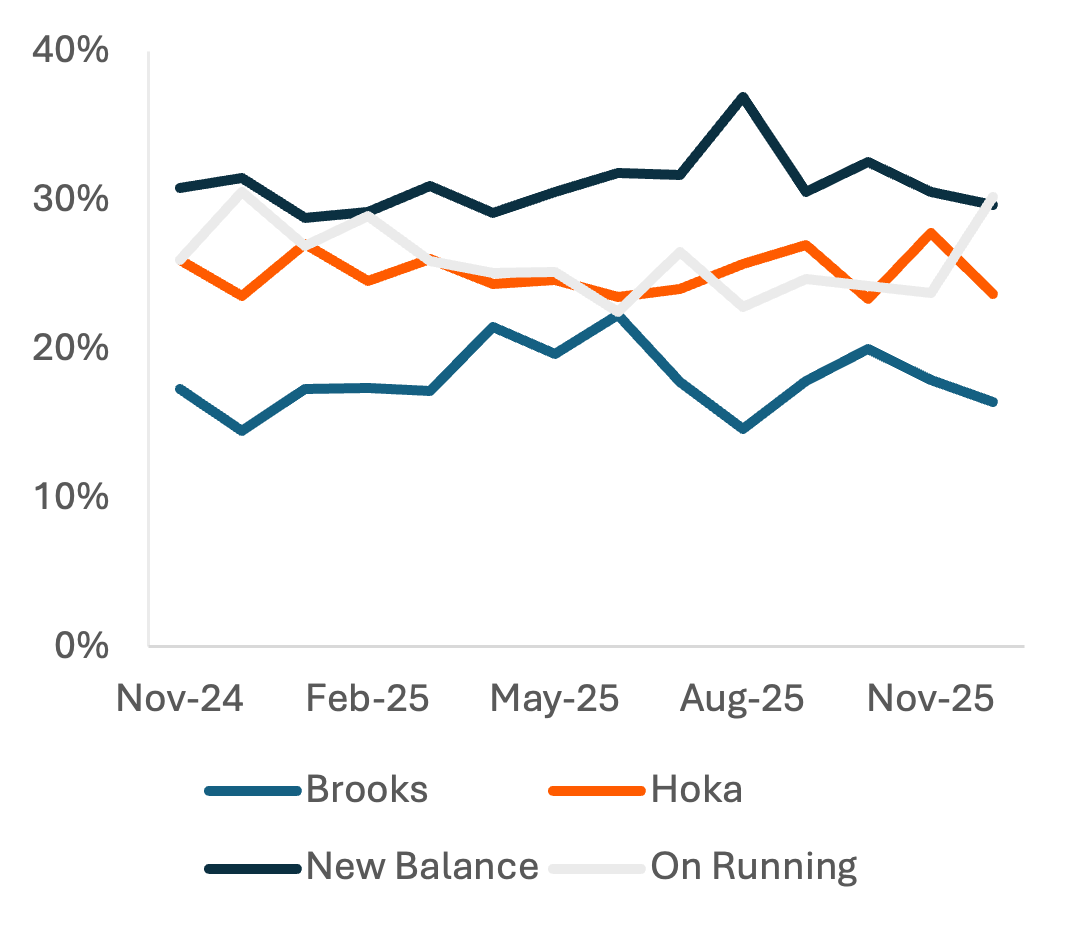
Hoka maintains ad spend on TikTok much better in the winter compared to New Balance, which has lost 40 pp of share since September after posting similar gains between December 2024 and January 2025. Consumer credit card spend market share remains more consistent than TikTok Shop market share, but Hoka, Brooks, and New Balance have all lost share to On Running in November and December.
Exhibit 16: TikTok Shop Estimated Revenue Market Share
Price: 1205.39 Tokens
Exhibit 17: TikTok Digital Ad Spend Market Share
Price: Not Available Through Platform or Block Delivery, Requires Custom Build
Exhibit 18: Credit Card Spend Market Share
Price: 11.18 Tokens
Deckers and Retail Partner Regional Trends
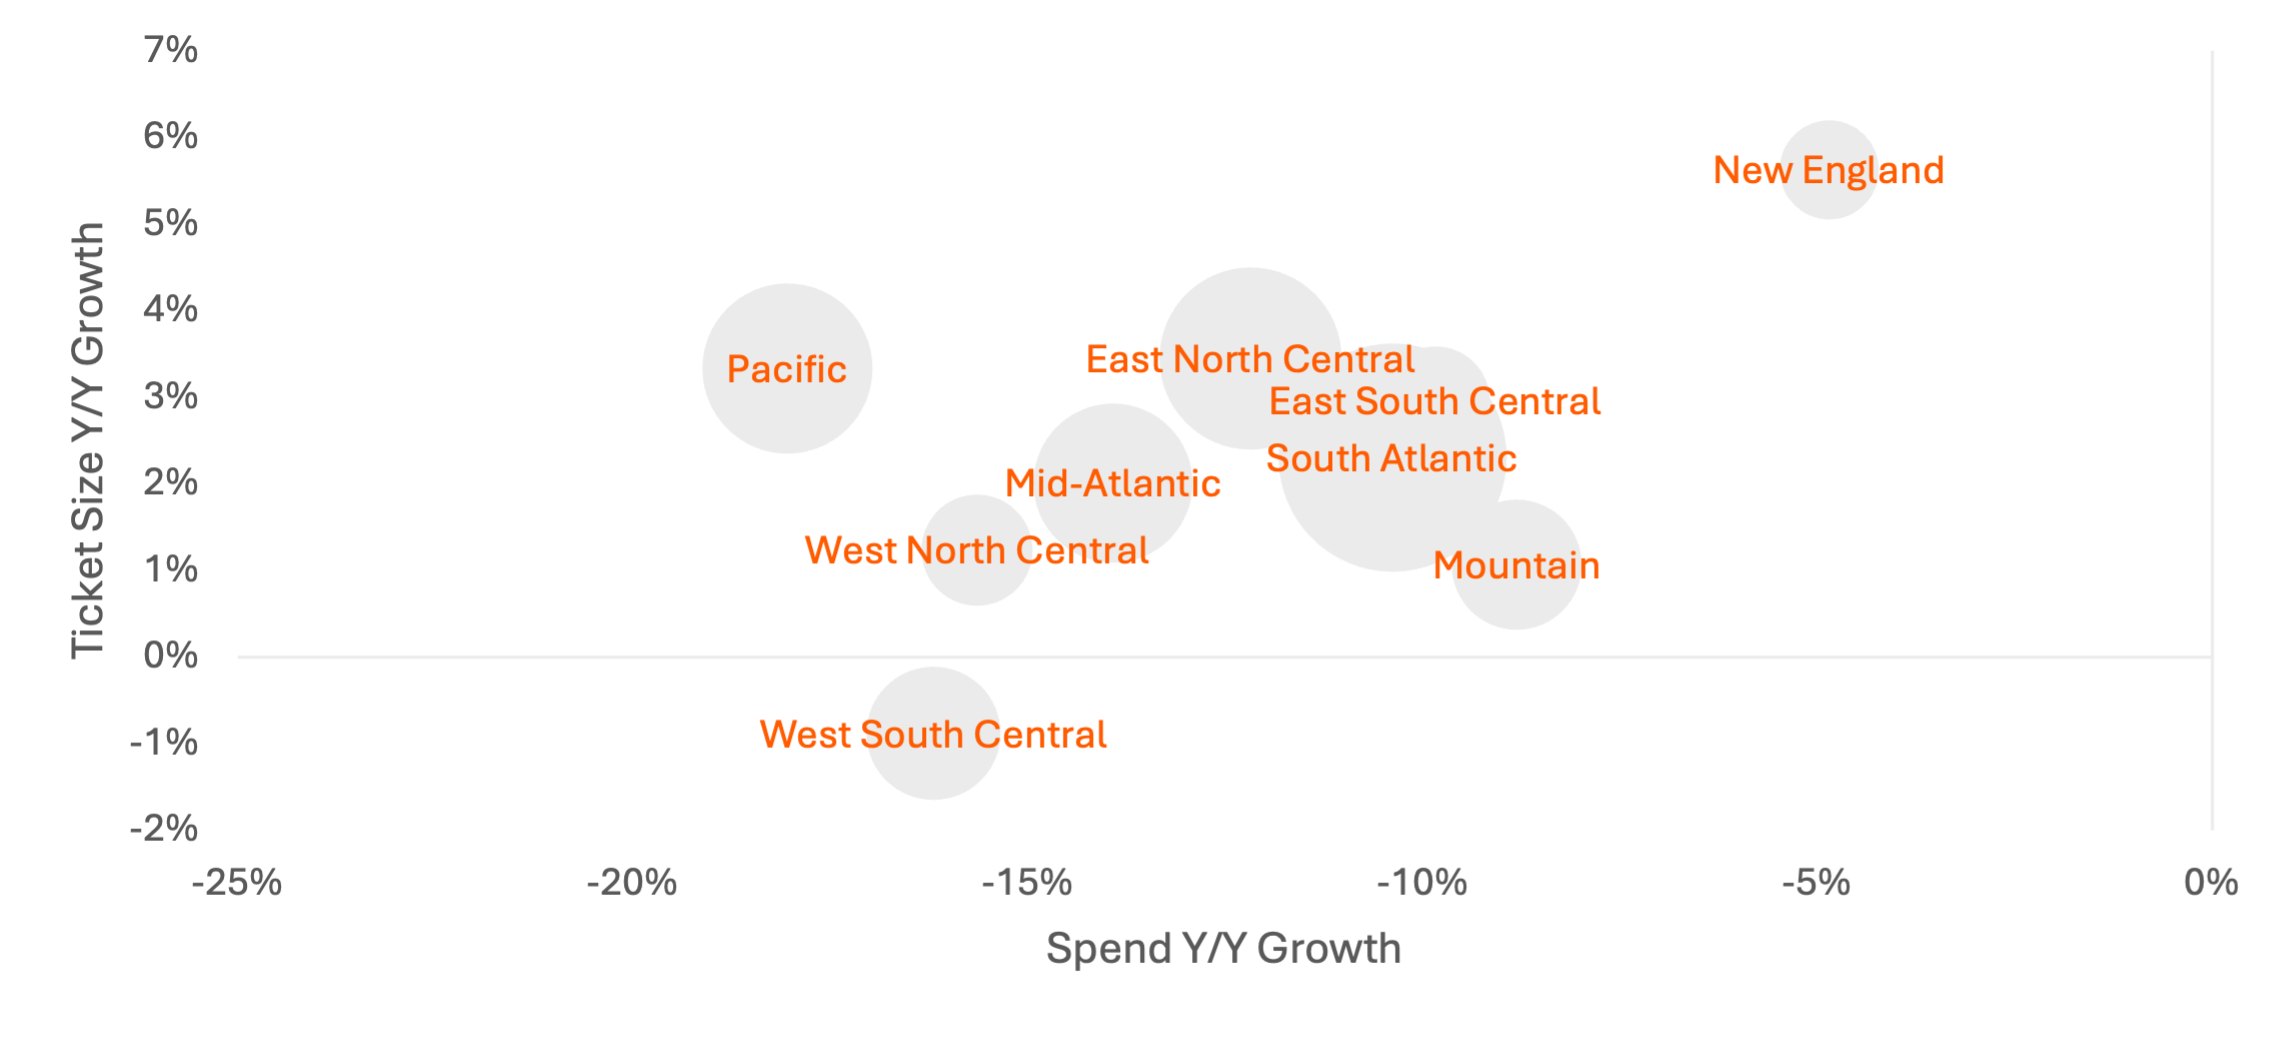
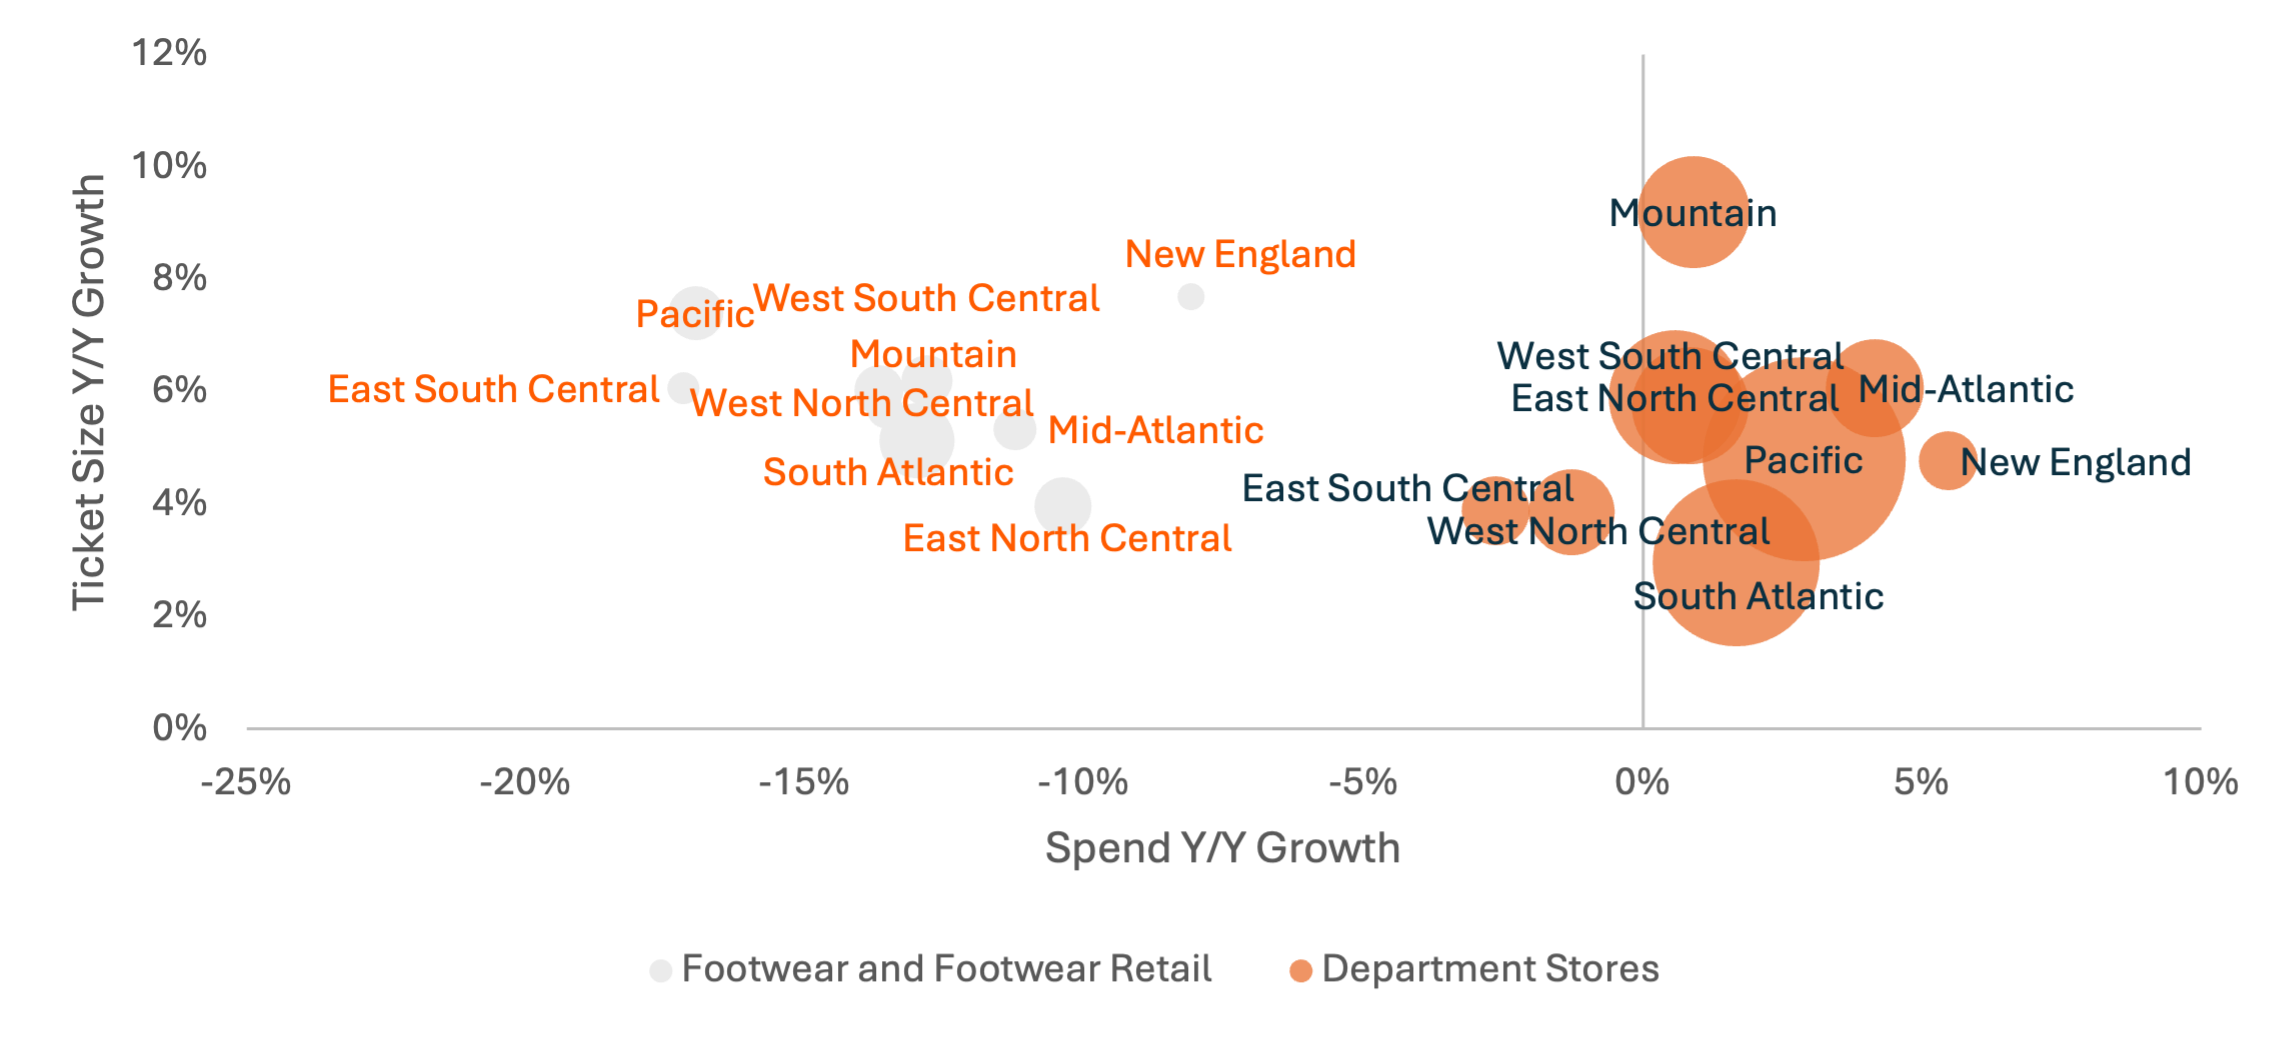
In 3QFY26, Deckers has performed substantially stronger in New England than elsewhere in the U.S., growing ticket size > 5% Y/Y and showing the lowest Y/Y declines in panel spend. Carbon Arc’s U.S. Complete Panel is a sample of 8 million consistently-used credit cards but is not benchmarked to reported growth rates. New England shoppers are also spending most heavily in both the footwear and department store retail categories, though ticket size growth at department stores is only average.
The largest regions for panel spend at DECK are the South Atlantic and East North Central. The two regions have experienced spend growth at department stores and footwear retailers in-line with the national average. However, they have seen some of the slowest ticket growth, suggesting consumer ticket growth with DECK in those regions is at risk of eroding.
Exhibit 19: Deckers 3QFY25 Credit Card Spend Growth by Region
Price: 102.71 Tokens
Exhibit 20: Category Credit Card Spend Growth by Region
Price: 308.13 Tokens
Ugg Demographic Insights
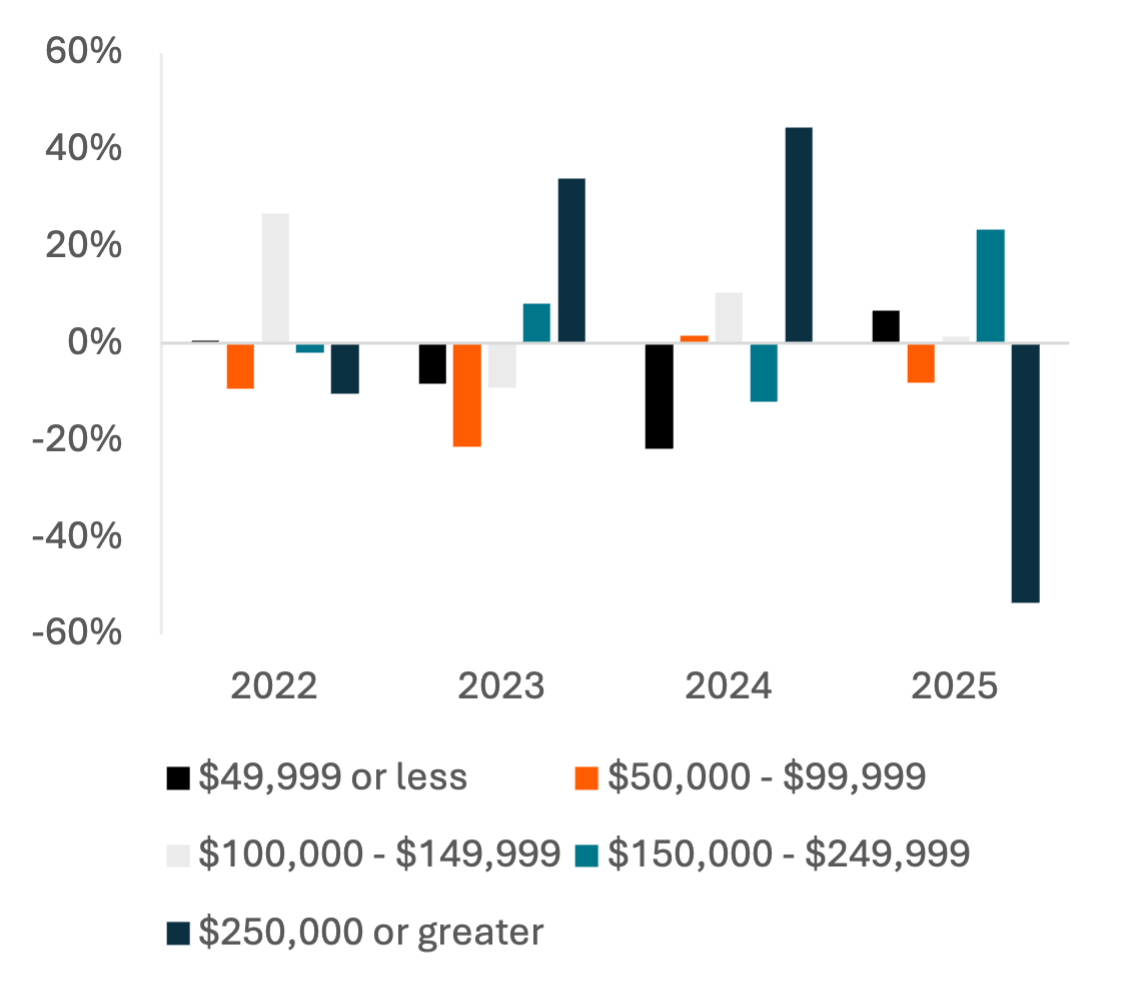
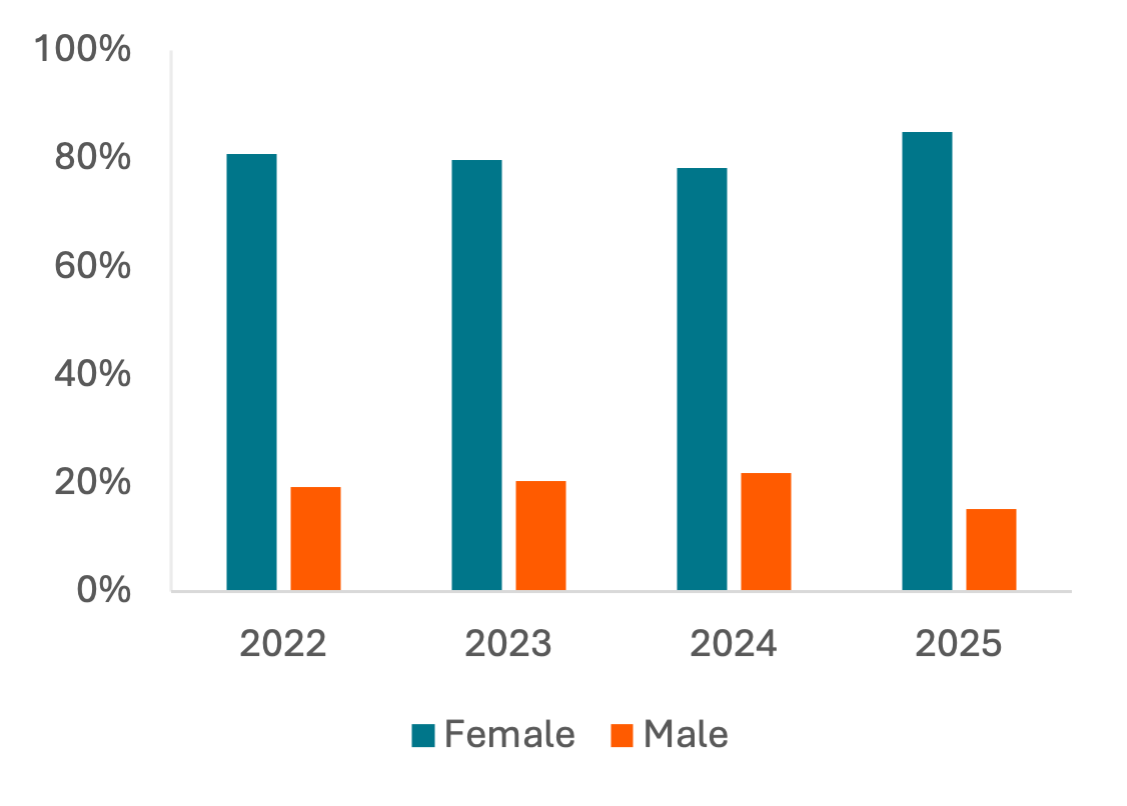
Normalized POS spend among Ugg’s highest-income consumers declined more than 50% in 2025, contradicting a ‘K-shaped’ economy narrative as other cohorts saw only slight declines or growth. In 2025, men are contributing to a lower share of Ugg spend than any of the prior 3 years, which may contribute to the spend trends by income. Ugg reported stronger 2024 sales for men in its 3QFY25 earnings call, citing a successful partnership with Post Malone and advertising placements during football games3.
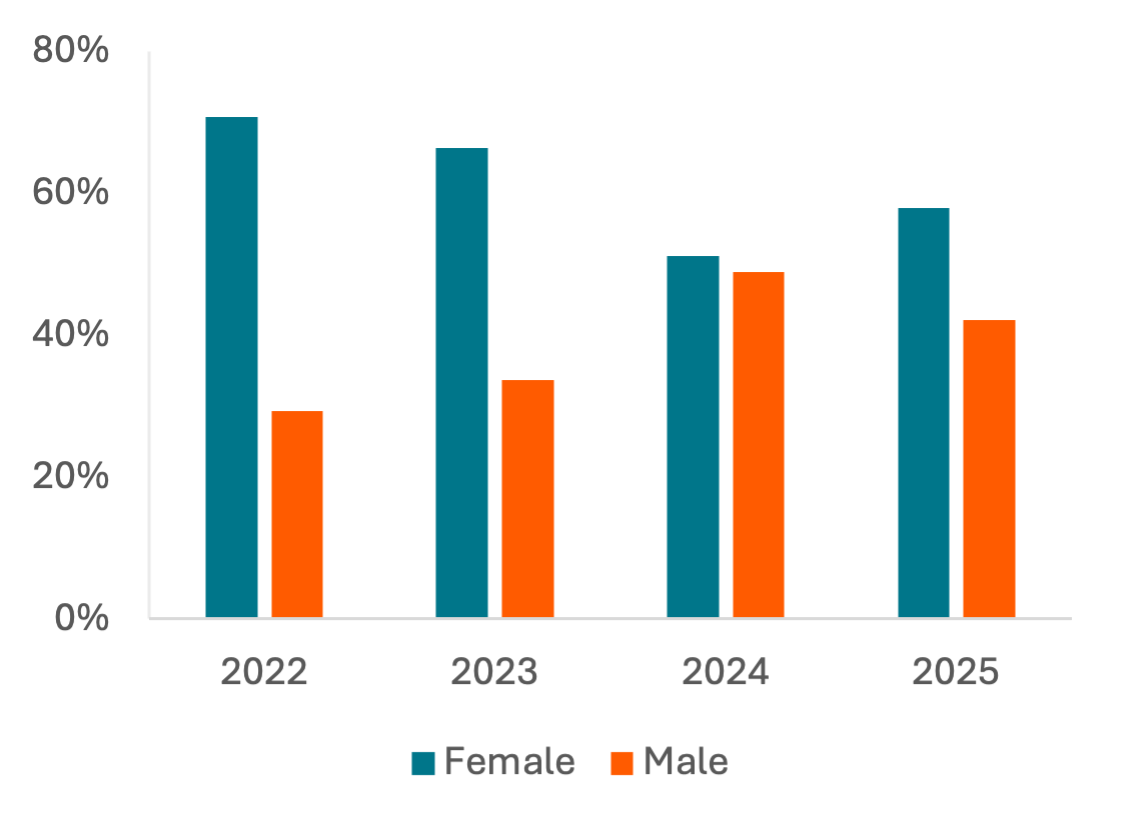
Web traffic by gender is much more even, but the share of web traffic from female consumers increased vs. 2025, though it is still below 2022 and 2023.
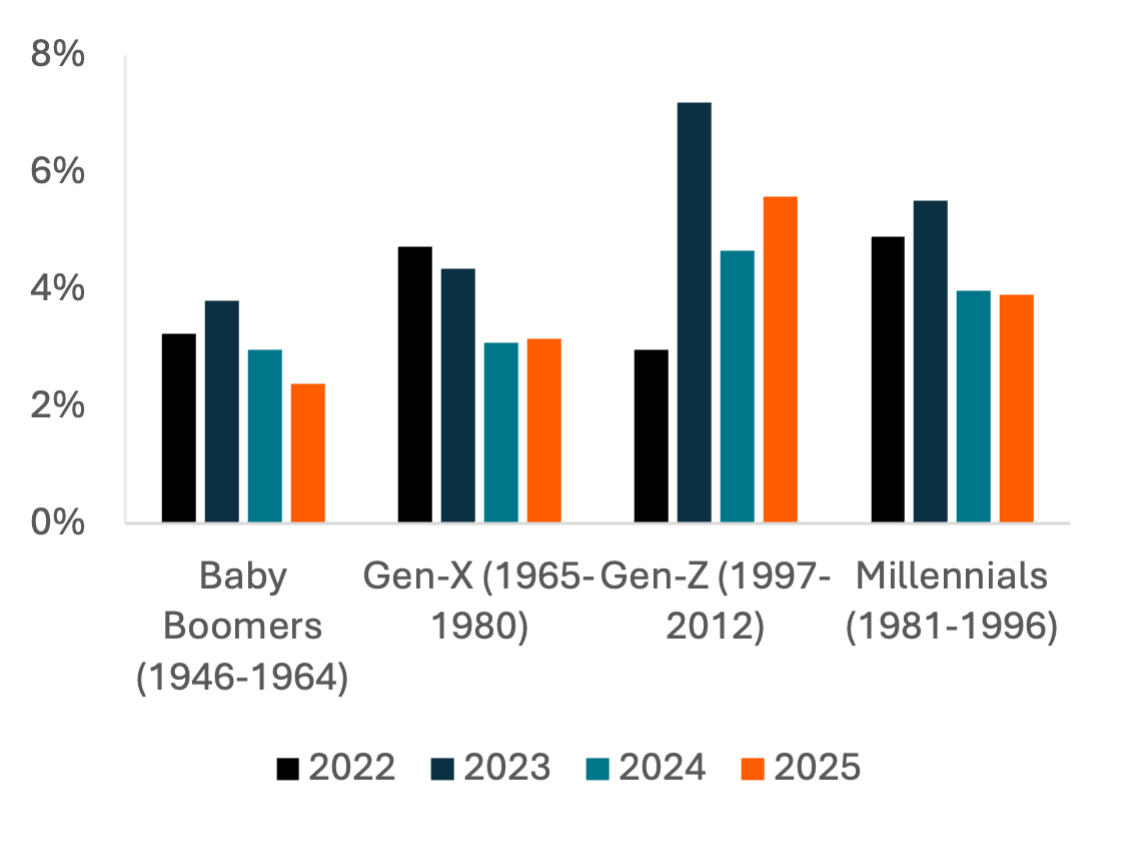
Ugg is very reliant on Millennial and Gen-Z consumers, people shopping for themselves, as it has consistently had a higher web traffic market share vs. footwear in those cohorts. Share is down for all cohorts since 2023, but has improved Y/Y for Gen-Z, its top-performing cohort of the last 3 years in terms of digital engagement share.
Exhibit 21: Ugg Normalized POS Spend Growth by Income
Price: 269.00 Tokens
Exhibit 22: Ugg POS Share of Spend by Gender
Price: 107.60 Tokens
Exhibit 23: Ugg Share of Web Traffic by Gender
Price: 4.99 Tokens
Exhibit 24: Ugg Web Traffic Market Share by Generation
Price: 7.70 Tokens
References
-
Deckers Brands. "Deckers Brands Reports Second Quarter Fiscal Year 2026 Financial Results." Press Release. October 31, 2025. https://ir.deckers.com/news-events/press-releases/press-release/2025/Deckers-Brands-Reports-Second-Quarter-Fiscal-Year-2026-Financial-Results/default.aspx
-
Deckers Outdoor Corp. "Second Quarter Fiscal 2026 Earnings Call Transcript." October 23, 2025. https://s25.q4cdn.com/376120126/files/doc_earnings/2026/q2/transcript/CORRECTED-TRANSCRIPT-_Deckers-Outdoor-Corp-DECK-US-Q2-2026-Earnings-Call.pdf
-
Deckers Outdoor Corp. "Third Quarter Fiscal 2025 Earnings Call Transcript." January 30, 2025. https://s25.q4cdn.com/376120126/files/doc_earnings/2025/q3/transcript/CORRECTED-TRANSCRIPT-_Deckers-Outdoor-Corp-DECK-US-Q3-2025-Earnings-Call.pdf
Questions?
Contact us at support@carbonarc.co if you have any questions!
CARARC-20251222-DECK-0001